


Gold – The bull market continues
After four corrective months and a final bloodbath towards the end of November, it looks as if the low is in! Gold – The bull market continues.
Review
On August 7th, the price of gold hit a new all-time high of US$2,075 . At that time we warned of the temporary end of the gold rush. As a result, over the past four months, there has been tough and stretched correction, with several pullbacks towards the support zone between US$1,850 and US$1,865.
By November 9th, gold prices had just recovered back to US$1,965 when the final bloodbath phase began quite abruptly. In the following days, with their fifth attempt the bears were finally able to break through the aforementioned support zone, forcing the gold market into a small panic sell-off. After all, this sell-off ended on November 30th with an intraday double low at US$1,764.
Since 9th of November Mondays have become quite challenging for gold
Since then, there has been a clear turnaround over the last three weeks. Quickly, the bulls staged an initial recovery to US$1,876 before gold came back down to test US$1,820 one more time. Since the FED press conference last Wednesday, gold bulls came roaring back pushing prices towards US,1906 further upwards. At the start of this trading week, however, as it happened most Mondays in the last eight weeks, gold got strongly pushed lower after reaching new highs at US$1,905. The sharp slide saw gold tumbling down testing its solid support at US$1,855 once again. In the meantime, prices have recovered that vicious attack and are trading around US$1,875 trying to stage another attack towards US$1,900.
Overall, the turnaround is not yet completely in dry cloths, but with a very high probability the bull market in the precious metals sector is now starting again fully.
Technical Analysis: Gold in US-Dollar
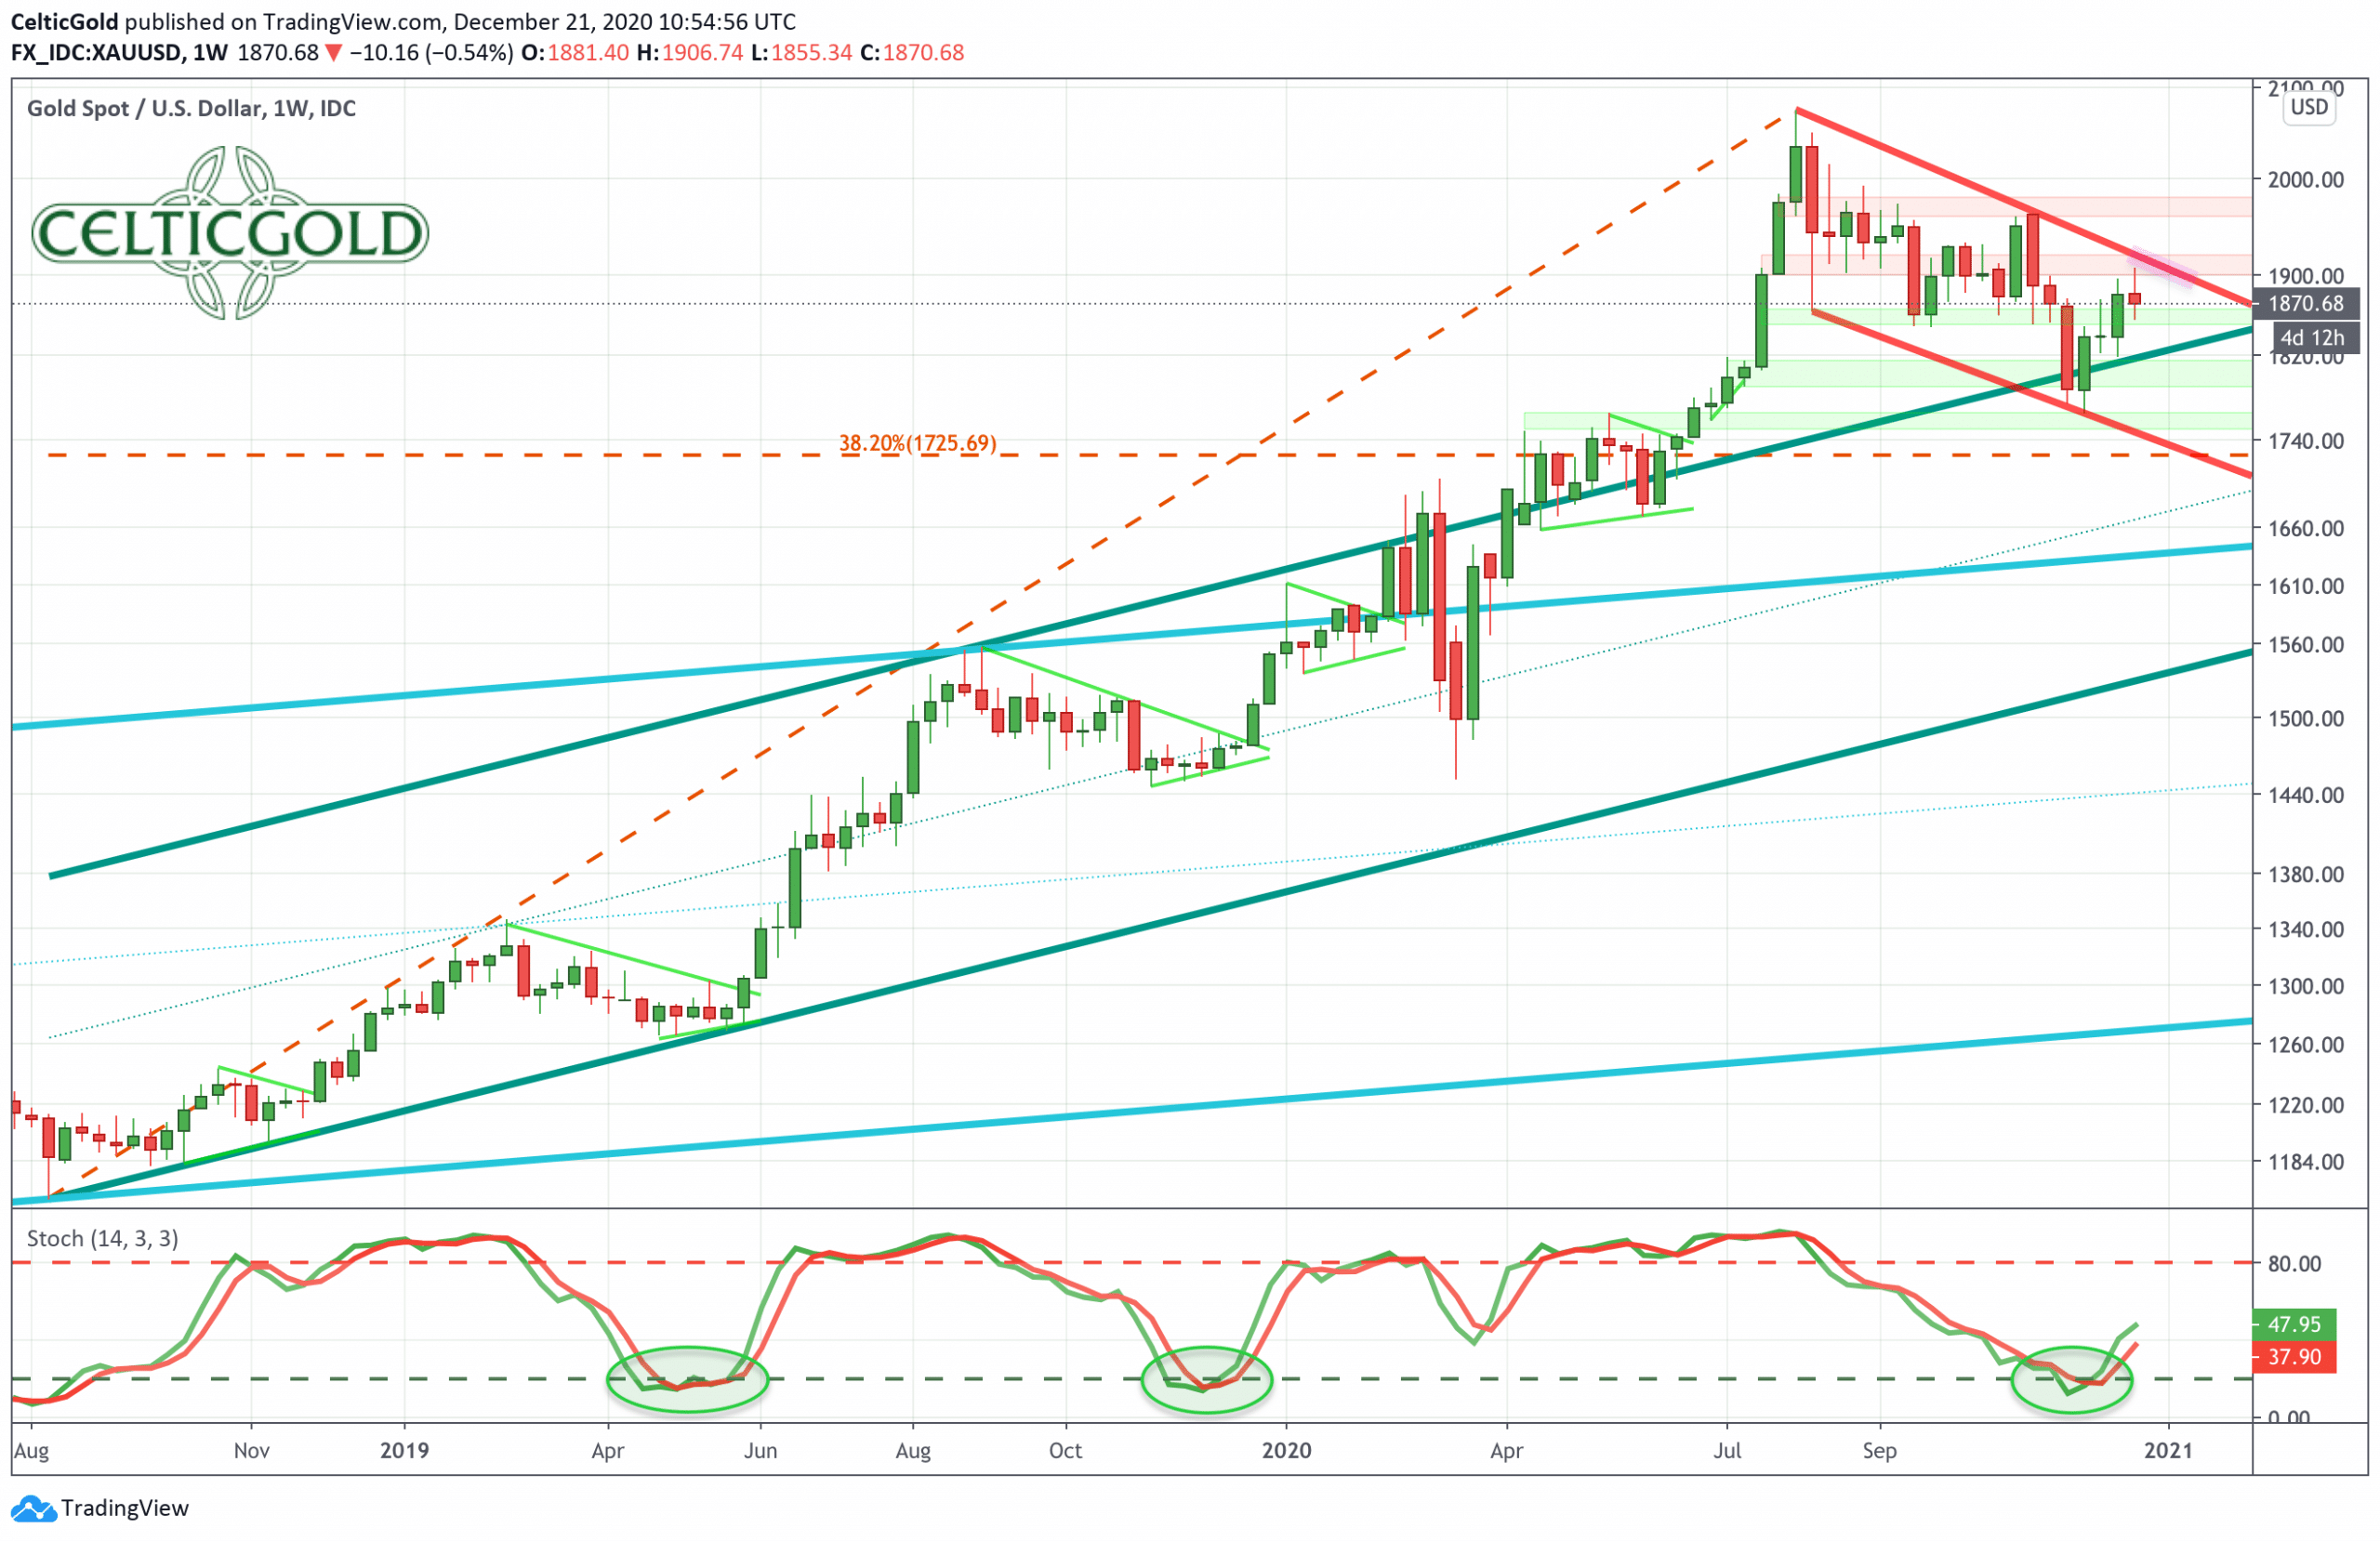
Gold in US-Dollars, weekly chart as of December 21st, 2020. Source: Tradingview
With a low at US$1,764, the timely forecasted correction bottomed most likely on November 30th. Since then, a recovery wave of more than US$140 has already been seen. The decisive element on the weekly chart now is the downtrend trend line of those last four months. Currently, this downtrend trend sits around US$1,915 and is moving a bit lower every day.
The mere sight of this strong line of resistance apparently caused a sudden panic attack among the gold bulls at the start of this week. Hence, gold prices briefly went off from US$1,905 towards US$1,855 within a few minutes. However, we expect a first real test of this resistance line above US$1,900 over the next few days and weeks.
Oversold weekly stochastic points to a contrarian opportunity
Overall, the chances for a breakthrough during the next one or two months are also very good, and thus further price increases until spring are highly likely. In particular, the new buying signal from the stochastic oscillator looks pretty promising. Since the great panic in the summer of 2018 and the beginning of the fulminant uptrend in the gold market (starting from a low at US$1,160 in August 2018), the stochastic oscillator delivered a similarly oversold setup only in spring 2019 and November 2019. Each of those two setups were a great contrarian buy opportunity as each time followed a very strong rally in the gold market.
In summary, we can assume the trend reversal for the gold market. Hence, over the next two to three months gold, silver and mining stocks should all move higher. A rally towards the November high at US$1,965 would be the absolute minimum for gold. More likely, however, would be a rally back above the psychological round number at US$2,000, including an extension towards US$2,015 and maybe even US$2,050. Nevertheless, this uptrend might present itself somewhat jerky and unround. Sharp pullbacks that emerge again and again will probably make life not that easy for trend-followers.
A new all time is realistic by mid-summer
Of course, a new all-time high above US$2,075 could also happen until early spring, given the exponentially increasing currency creations worldwide. Yet, it is not the primary scenario. More realistic would be a new all-time high during the second seasonally strong phase somewhere in midsummer.
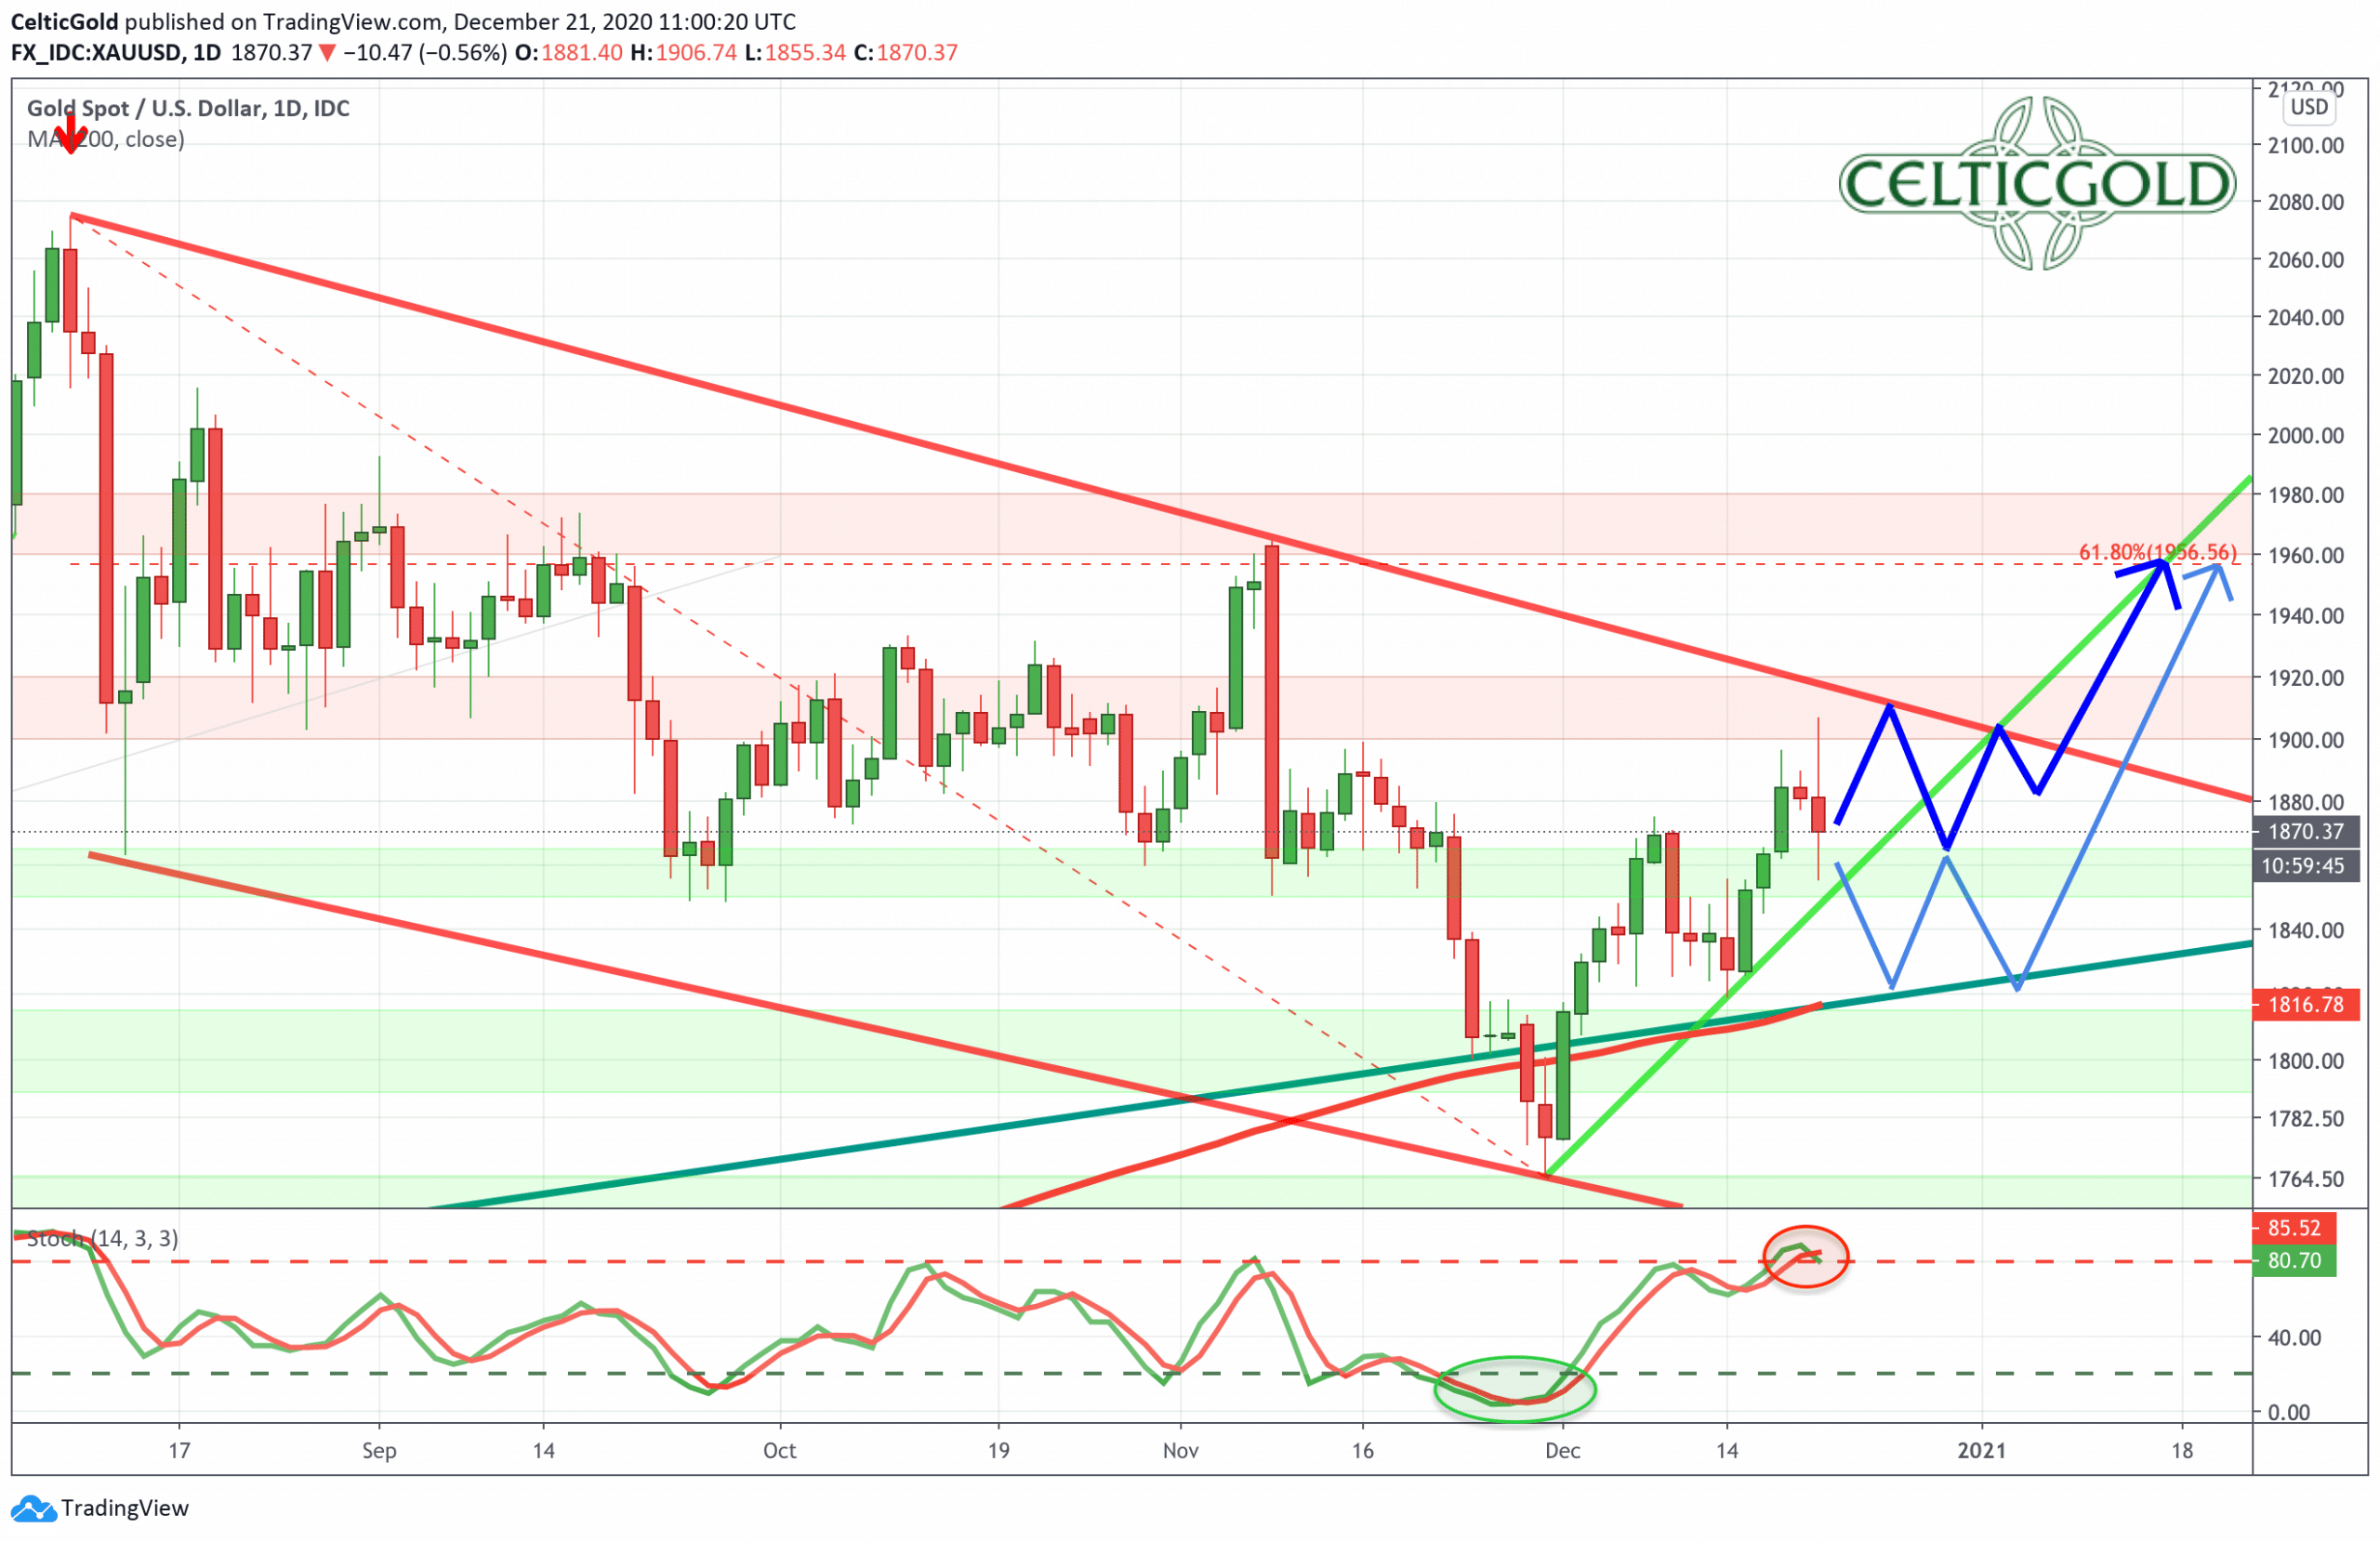
Gold in US-Dollars, daily chart as of December 21st, 2020. Source: Tradingview
On the daily chart, the resistance zone between US$1,900 and US$1,920 becomes more obvious. This zone will most likely keep the gold bulls busy for a few more weeks. Moreover, as the stochastic oscillator on the daily chart has already reached its overbought zone, expecting a trading range between US$1,850 and US$1,920 likely well into mid of January is crucial.
The support zone between US$1,850 and US$1,865 now has a very important catch-up function. If, contrary to expectations, this support does not hold, a further test of the upper edge of the medium-term uptrend channel around US$1,820 would also be acceptable. The 200-day moving avarage (US$1,816) is also approaching this price level. However, gold prices should not fall much lower, otherwise the bullish scenario will have to be questioned.
In the conclusion, the daily chart is still bullish. An attack towards downtrend line slightly above US$1,900 is the most likely scenario in the short-term. However, this Monday’s sharp sell-off gives already a taste of the strength of this downtrend line. Pullbacks towards US$1,850 to US$1,865 and in particular another test of the 200-day moving average around US$1,820 would be another good entry opportunity. Only below US$1,800 will the bull market be in jeopardy. On the other side, the breakout above US$1,920 confirms the bullish case and opens up further potential towards US$1,955 and US$1,965.
Commitments of Traders for Gold – The bull market continues
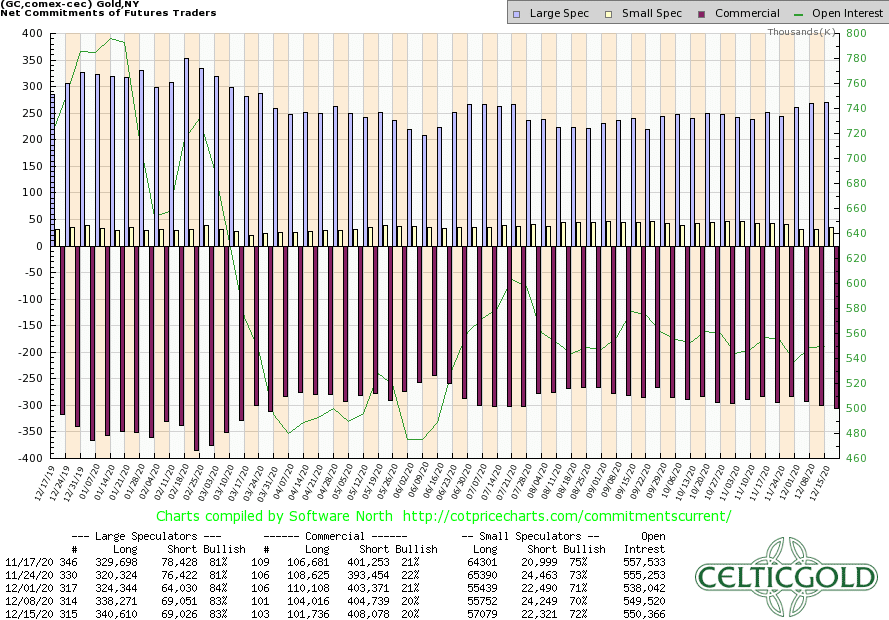
Commitments of Traders for Gold as of December 15th, 2020. Source: CoT Price Charts
According to the lastest CoT-report, the commercial short position increased again slightly. Overall, however, the constellation of the last one and a half years has hardly changed at all as the commercial traders continue to hold an extremely high short position. This accumulated position currently sits at 306.342 short contracts.
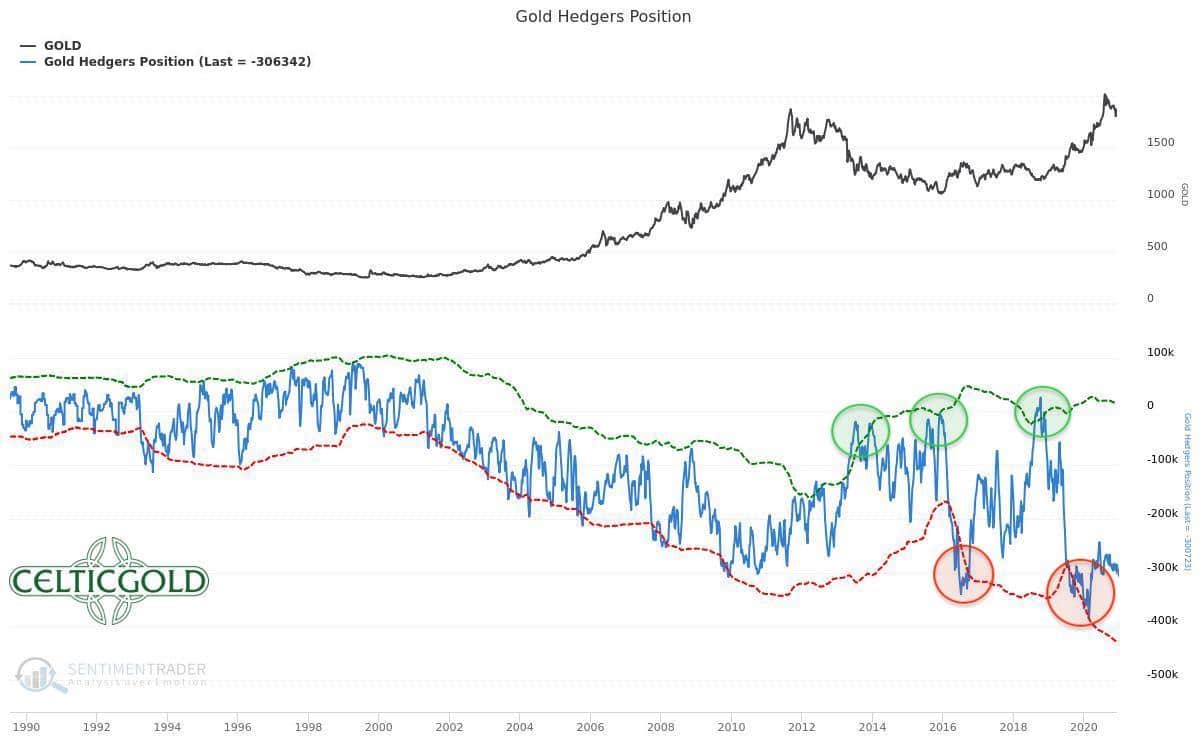
Commitments of Traders for Gold as of December 15th, 2020. Source: Sentimentrader
Overall, and on its own alone, the weekly CoT-report continues to provide a clear sell signal for gold. This has been the case for more than a year already and continues to signal a great need for correction.
Sentiment: Gold – The bull market continues
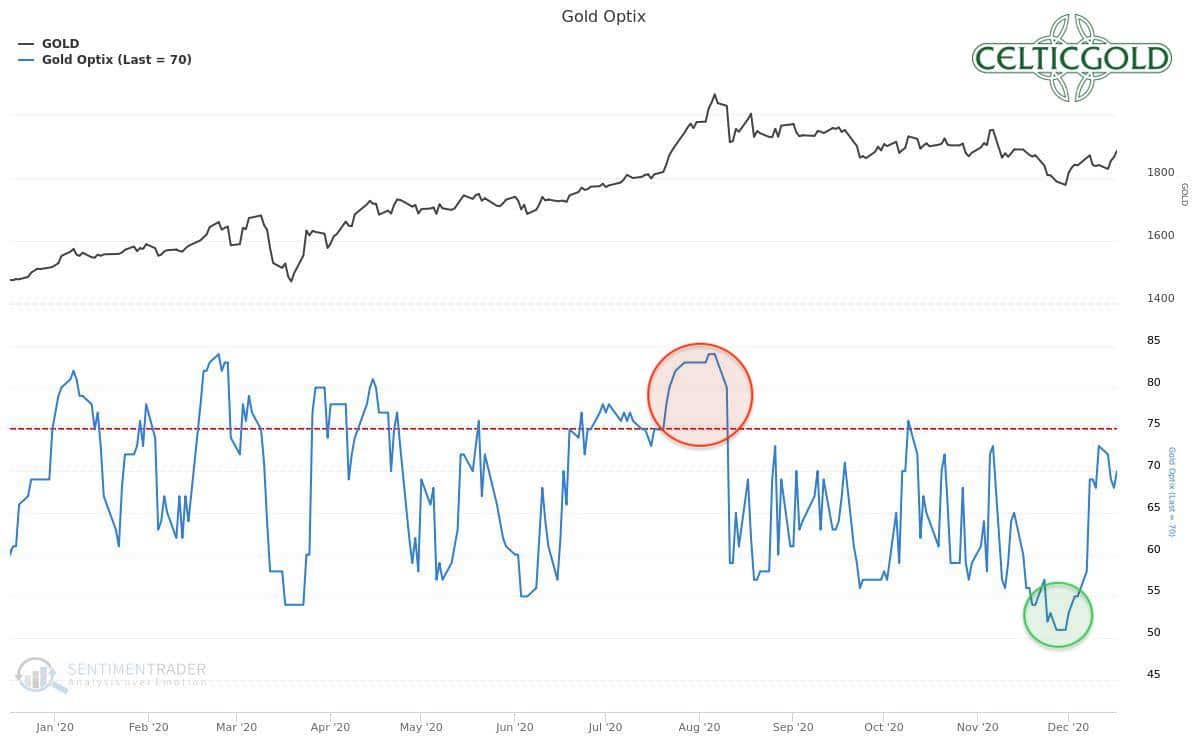
Sentiment Optix for Gold as of December 18th, 2020. Source: Sentimentrader
With the sharp sell-off until the end of November, the precious metals sector was at least partially cleaned up with a final bloodbath lasting several days. The great euphoria of the summer has thus turned into the opposite. Although the quantitative sentiment indicators did not signal any real panic, those low levels of optimism should still have been sufficient for a sustained bottom and turnaround.

BofA Global Investment Strategy, EPFR Global
Interestingly enough, November saw exorbitant outflows from the gold ETFs. Here, huge quantities of gold were thrown onto the market in a panic attack with the push of a mouse click. And this despite the fact that the price of gold simply went through a normal and expected correction since the summer. This chart clearly speaks for a cleanup of the weak hands!
Overall, the sentiment analysis thus provides a good starting point for the first quarter of 2021. In the short-term, however, optimism is already a little too high. The path towards a higher gold price should therefore not be straightforward in the next few weeks but might be interrupted again and again by treacherous pullbacks.
Seasonality: Gold – The bull market continues
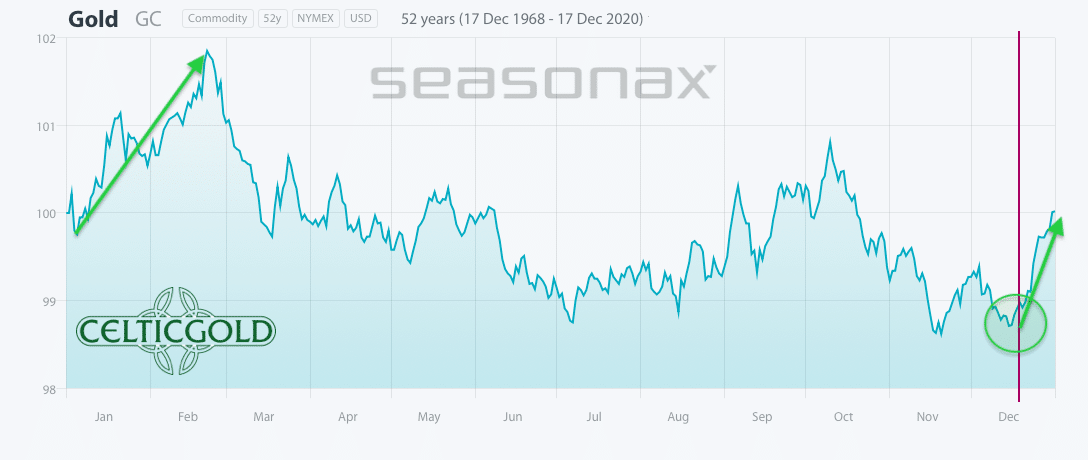
Seasonality for Gold as of December 18th, 2020. Source: Seasonax
Seasonal-wise, all traffic lights are green over the next two months, as the price of gold has statistically been mostly able to rise until mid to end of February and often into spring. Hence, from the seasonal perspective, caution is recommended from early march onwards.
Overall, seasonality these days provides a strong buy signal.
Sound Money: Bitcoin/Gold-Ratio
With prices of US$23,400 for one Bitcoin and US$1,865 for one troy ounce of gold, the Bitcoin/Gold-ratio is currently 12,54. That means you have to pay more than 12 ounces of gold for one single bitcoin! In other words, a fine ounce of gold currently costs only 0,079 Bitcoin, which means another loss of more than 30% for gold against bitcoin. Bitcoin has been mercilessly outperforming the price of gold for the last several months.
Generally, you should be invested in both: precious metals and bitcoins. Buying and selling Bitcoin against gold only makes sense to the extent that one balances the allocation in the two asset classes! At least 10% but better 25% of one’s total assets should be invested in precious metals (preferably physically), while in cryptos and especially in Bitcoin, one should hold 1% to 5%. Paul Tudor Jones holds a little less than 2% of his assets in Bitcoin. If you are very familiar with cryptocurrencies and Bitcoin, you can certainly allocate higher percentages to Bitcoin and maybe other Altcoins on an individual basis. For the average investor, who usually is primarily invested in equities and real estate, 5% in the highly speculative and highly volatile bitcoin is already a lot!
“Opposites compliment. In our dualistic world of Yin and Yang, body and mind, up and down, warm and cold, we are bound by the necessary attraction of opposites. In this sense you can view gold and bitcoin as such a pair of strength. With the physical component of gold and the digital aspect of bitcoin (BTC-USD) you have a complimentary unit of a true safe haven in the 21st century. You want to own both!”– Florian Grummes
Patience is recommended if you are not yet (fully) invested in Bitcoin
Only a significant pullback in the next one to four months towards and maybe even below the old all-time high at around US$20,000 would result in another opportunity to enter or allocate into bitcoin.
Macro update and conclusion: Gold – The bull market continues
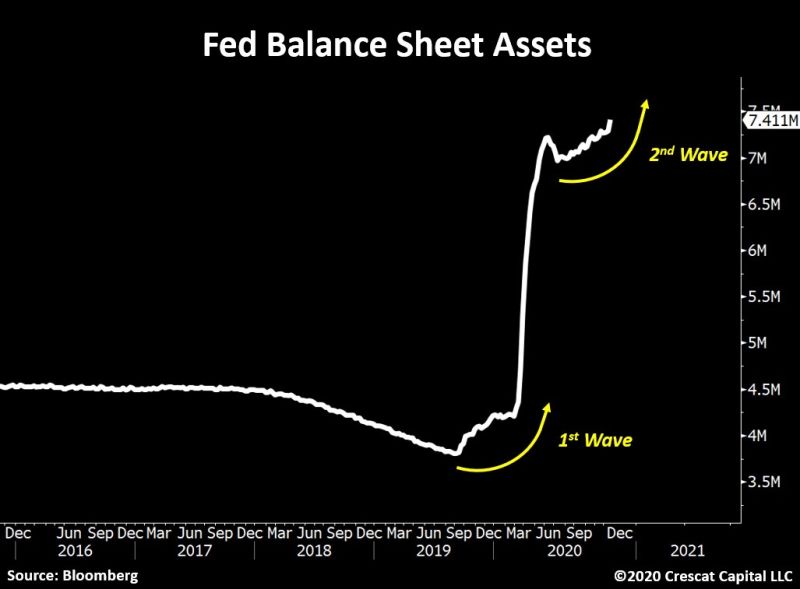
Tavi Costa, Crescant Capital, December 20th, 2020.
For almost 16 months, the balance Sheet of the Federal Reserve Bank (FED) in the US has been exploding. In recent weeks, a new all-time high has been reached. Hence, the devaluation of the US-dollar (=fiat money) is therefore unabatedly continuing and is expected to accelerate further next year.
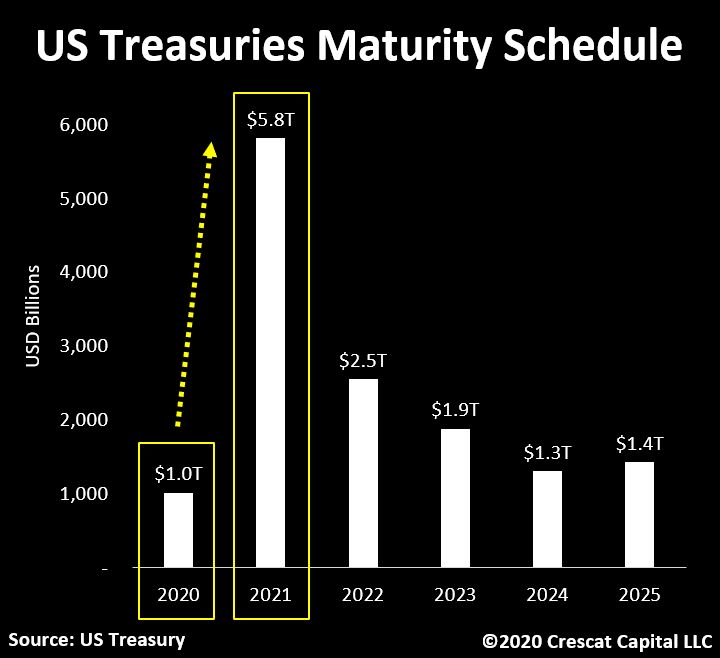
Tavi Costa, Crescant Capital, December 22nd, 2020.
Over US$1 trillion in US Treasuries will be due in the next 15 days alone! The current pace of currency creation of around US$80 billion per month will not be enough, as much more US Treasuries in the order of US$5.8 trillion will be due curing the course of next year. US central bankers are caught in a trap and will have to create ever-increasing amounts of currency out of nowhere.
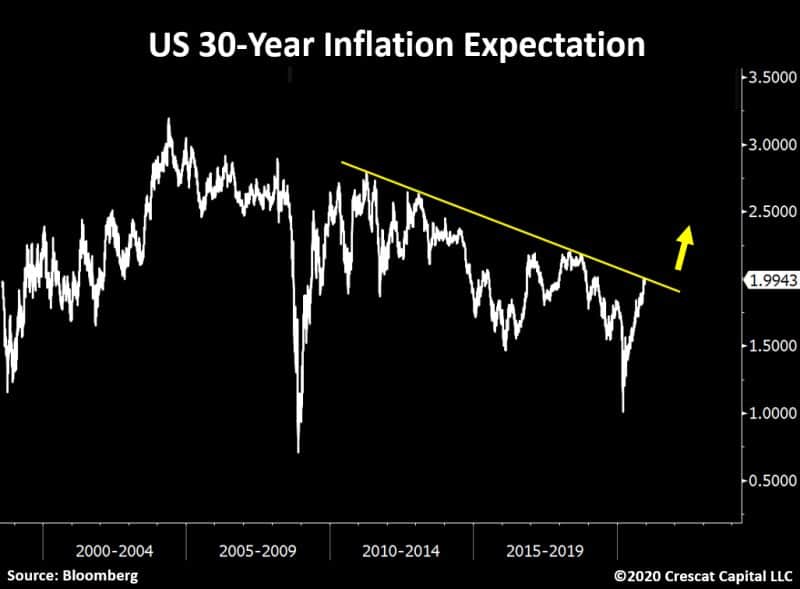
Tavi Costa, Crescant Capital, December 18th, 2020.
Logically, therefore, inflation expectations in the US as well as worldwide are rising sharply.
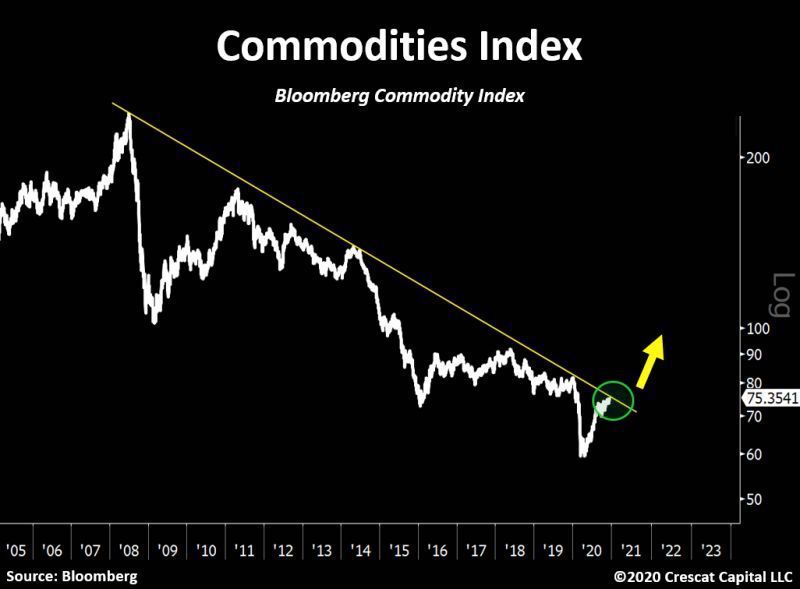
Tavi Costa, Crescant Capital, December 22nd, 2020.
At the same time, commodity prices are also on the verge of breaking out above their 12-year downtrend line and are expected to continue to rise strongly during the course of 2021.
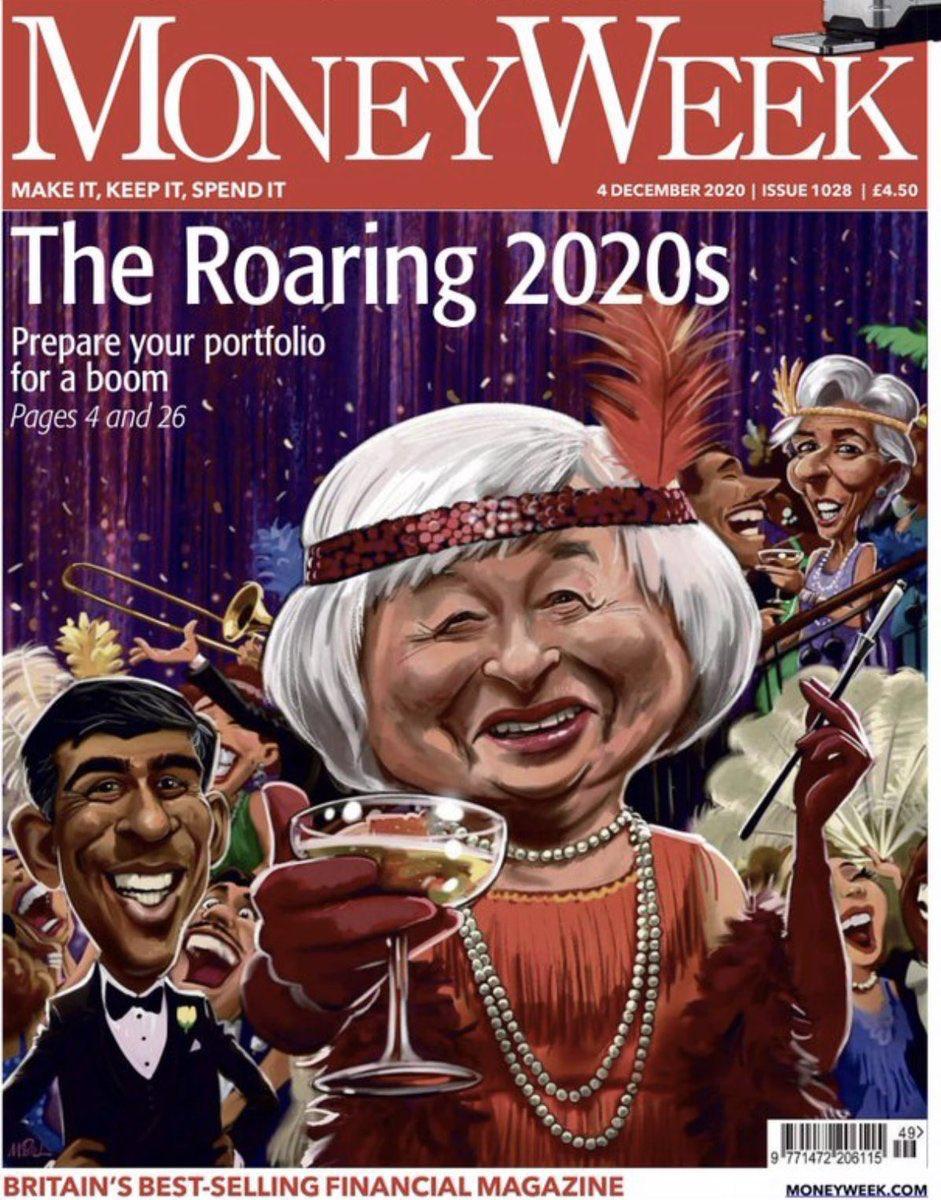
MoneyWeek, December 4th, 2020.
Not surprisingly, investors and financial market participants are therefore in a roaring 20s mood! For the broad population, however, this is a catastrophic development, as inflation will devalue their monthly salary more and more quickly.
For precious metals and the price of gold instead, this is the best of all worlds. At least until the spring, a recovery rally is expected for gold towards US$2,000 and silver towards US$30. Hence, another buying opportunities would present itself should gold drop one more time towards US$1,850 and US$1,820, respectively. Following the current “tax loss selling” and the start of 2021, mining stocks should take over the lead in the sector again and could then outperform gold and silver until spring.
Forecasting the full year 2021, silver in particular should be able to benefit from the rising inflation. Over the course of the year, a test of the all-time high around US$50 is conceivable. In midsummer at the latest, the price of gold should also be able to break out above US$2,100.
Overall, silver and bitcoin remain the dream-team for the accelerating crack-up boom.
Source: www.celticgold.eu
We post real time entries and exits for the silver market in our free Telegram channel.
If you like to get regular updates on our gold model, precious metals and cryptocurrencies you can subscribe to our free newsletter.

