


Bitcoin – Breakout In Progress
After a great start into 2020 bitcoin crashed together with all other markets during the corona panic. Now bitcoin has full recovered from these dark moments in mid of march and has just yesterday crossed the US$10,000 level once again – a breakout in progress. While central bankers around the world are quantitatively easing their fiat ponzi schemes, bitcoin will experience its third quantitative hardening in just a few days….
Review
In my last Bitcoin analysis, at a price around US$6,700, I expected the recovery to continue until around US$8,000. Indeed, this is what happened. However, for several weeks prices were just slowly creeping higher. Only once the downtrend line at US$7,150 was crossed the bitcoin market finally began to move on 23rd of April. Since then, the bullish forces have clearly asserted themselves and most recently drove bitcoin to its highest level at US$10,025 since mid of February. Bitcoin has thus made up for all the losses from the crash in mid-March and presents itself very strong compared to almost all other asset classes.
© Holger Zschaepitz @Schuldensuehner, 5th of May 2020
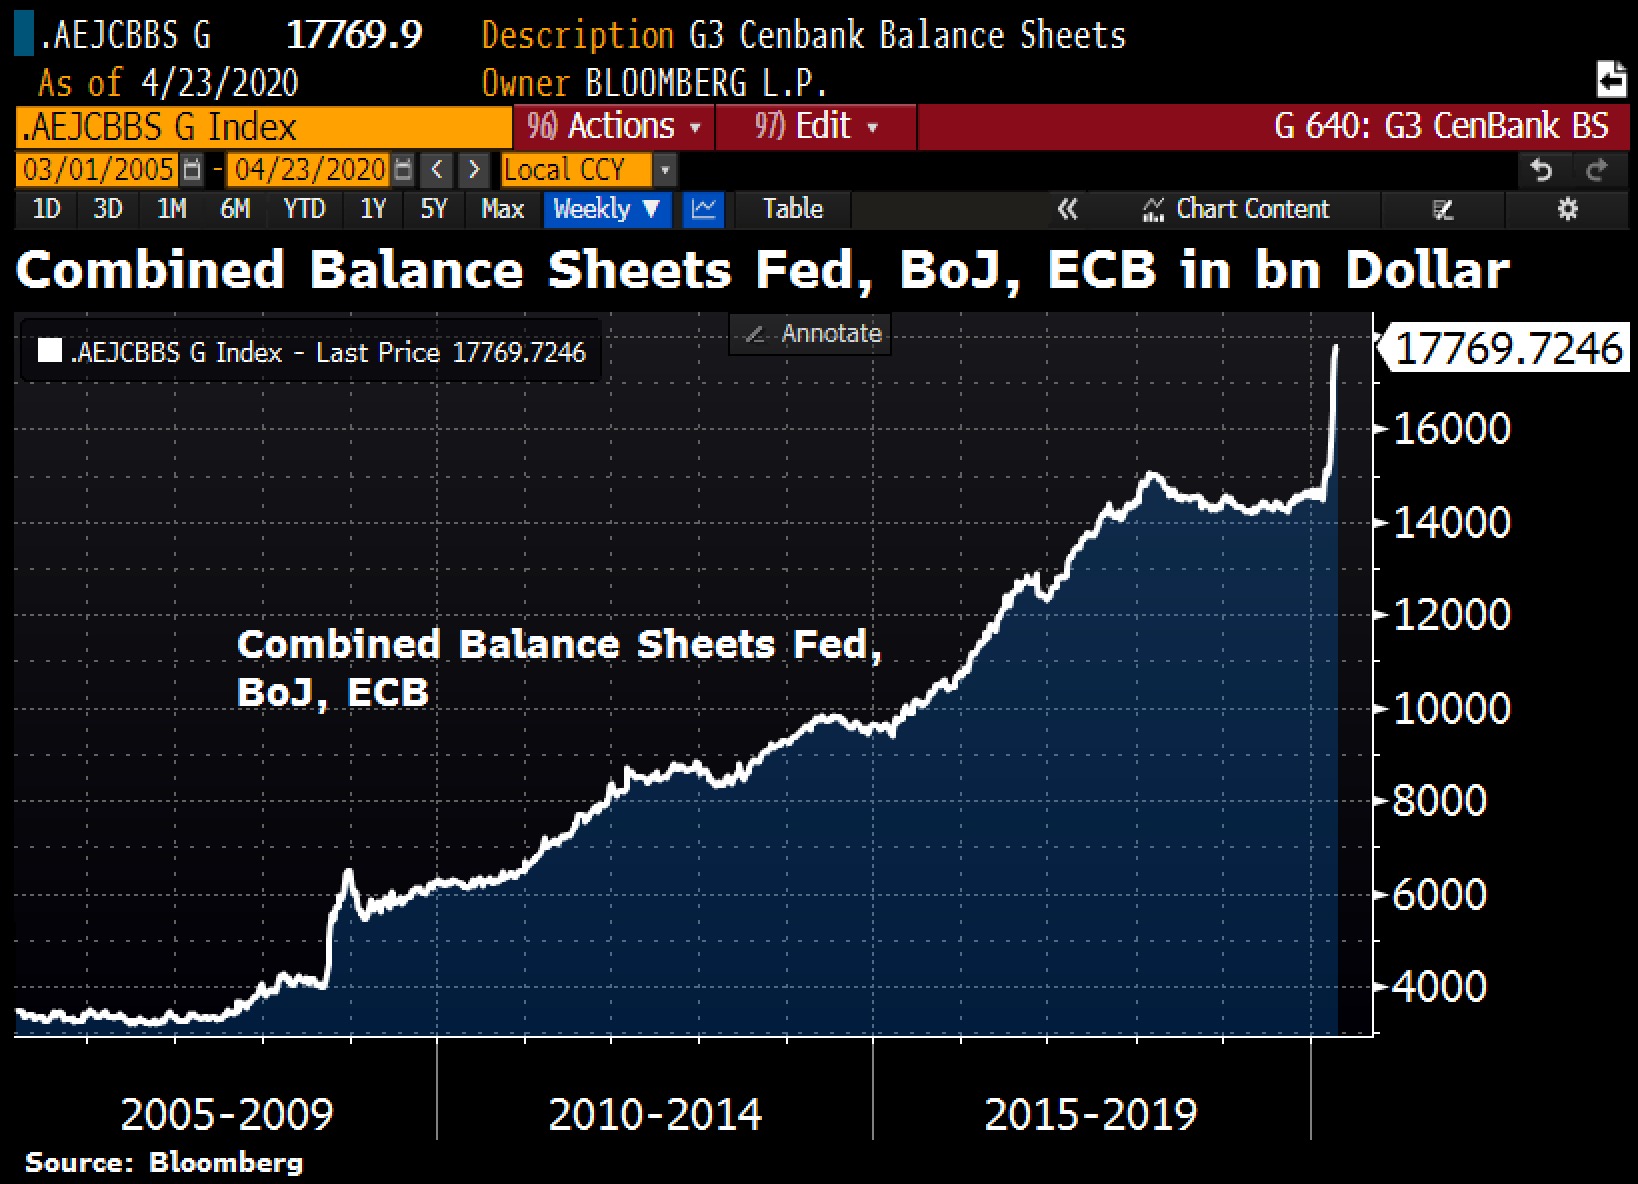
In addition to the technical breakout above US$7,150, the reasons for the sharp rally in recent weeks are mainly to be found in the upcoming bitcoin halving and the unprecedented global money supply expansions. The corona crisis has definitely changed the world. An infinite number of small and large companies as well as an army of millions of new unemployed are now completely dependent on public funding. At every corner there is overcapacity, reflecting the sick frenzy of the last decades. With their balance sheet measurements, central banks are already surpassing everything that has been seen before, but in the end they too will have to realize that wealth cannot be created with the mere printing of currency.
© Holger Zschaepitz @Schuldensuehner, May 4th 2020
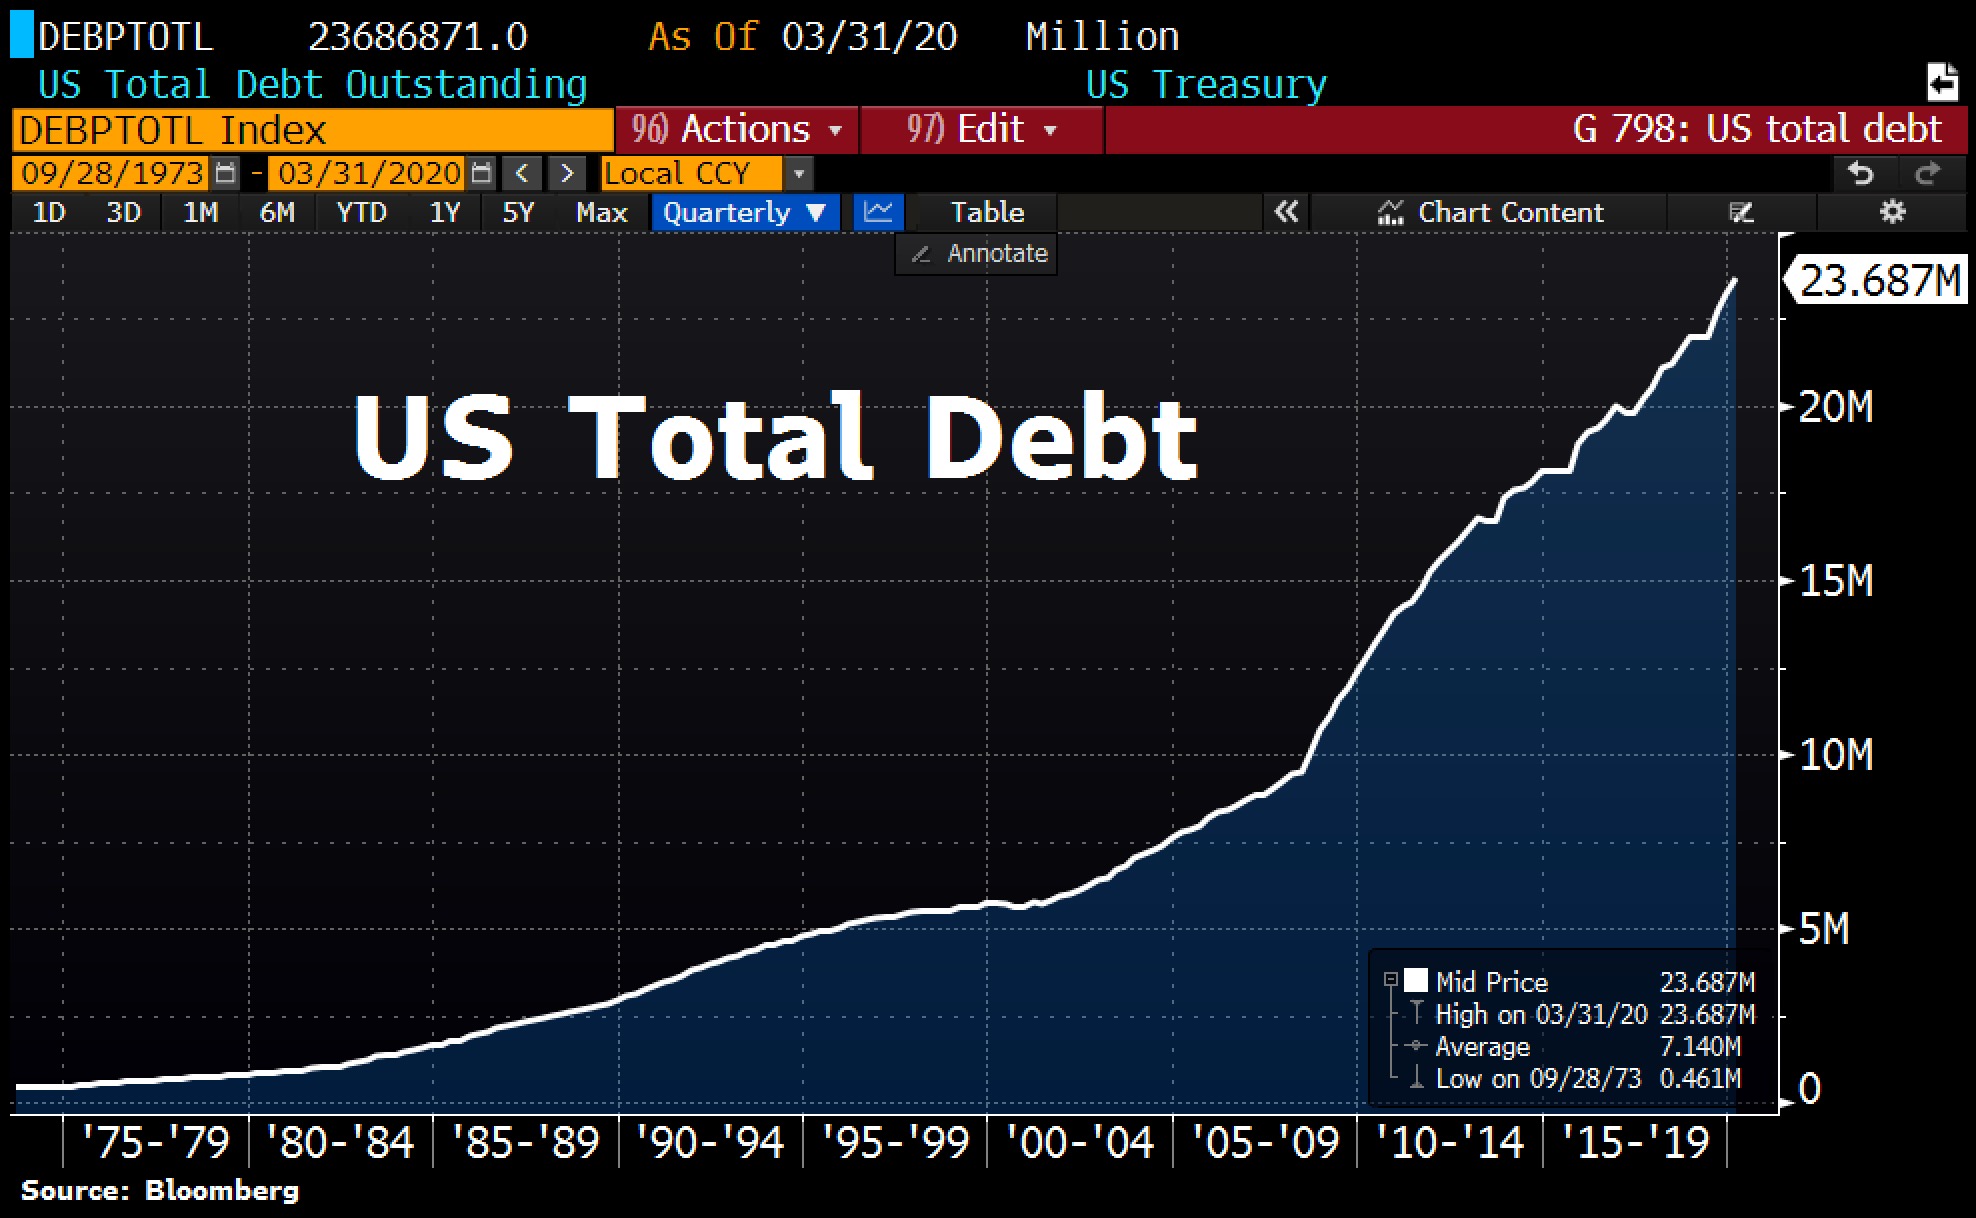
On the contrary, the dramatic increase in debt will sooner or later devalue the purchasing power of euros and dollars etc. to an extreme degree. The US Treasury Department, for example, is planning a new record borrowing of US$3 trillion between April and June in order to be able to pay the enormous coronavirus costs. A further US$ 677 billion is planned for the 3rd quarter. Last year, US$1.28 trillion new debts were already made. In the end, it is the citizens and taxpayers who pay this bill.
“Fiat = Quantitative easing, Bitcoin = Quantitative hardening” – Dan Held
Forward-thinking investors have therefore stormed into the safe haven of gold in recent weeks. In the case of bitcoin, despite its relative strength, there has so far been no real sign of a flight to safety. Instead, the crypto currency has correlated much more strongly with the stock markets in recent weeks than usual. However, since about two weeks bitcoin is literally on fire.
Technical Analysis For Bitcoin – Breakout In Progress
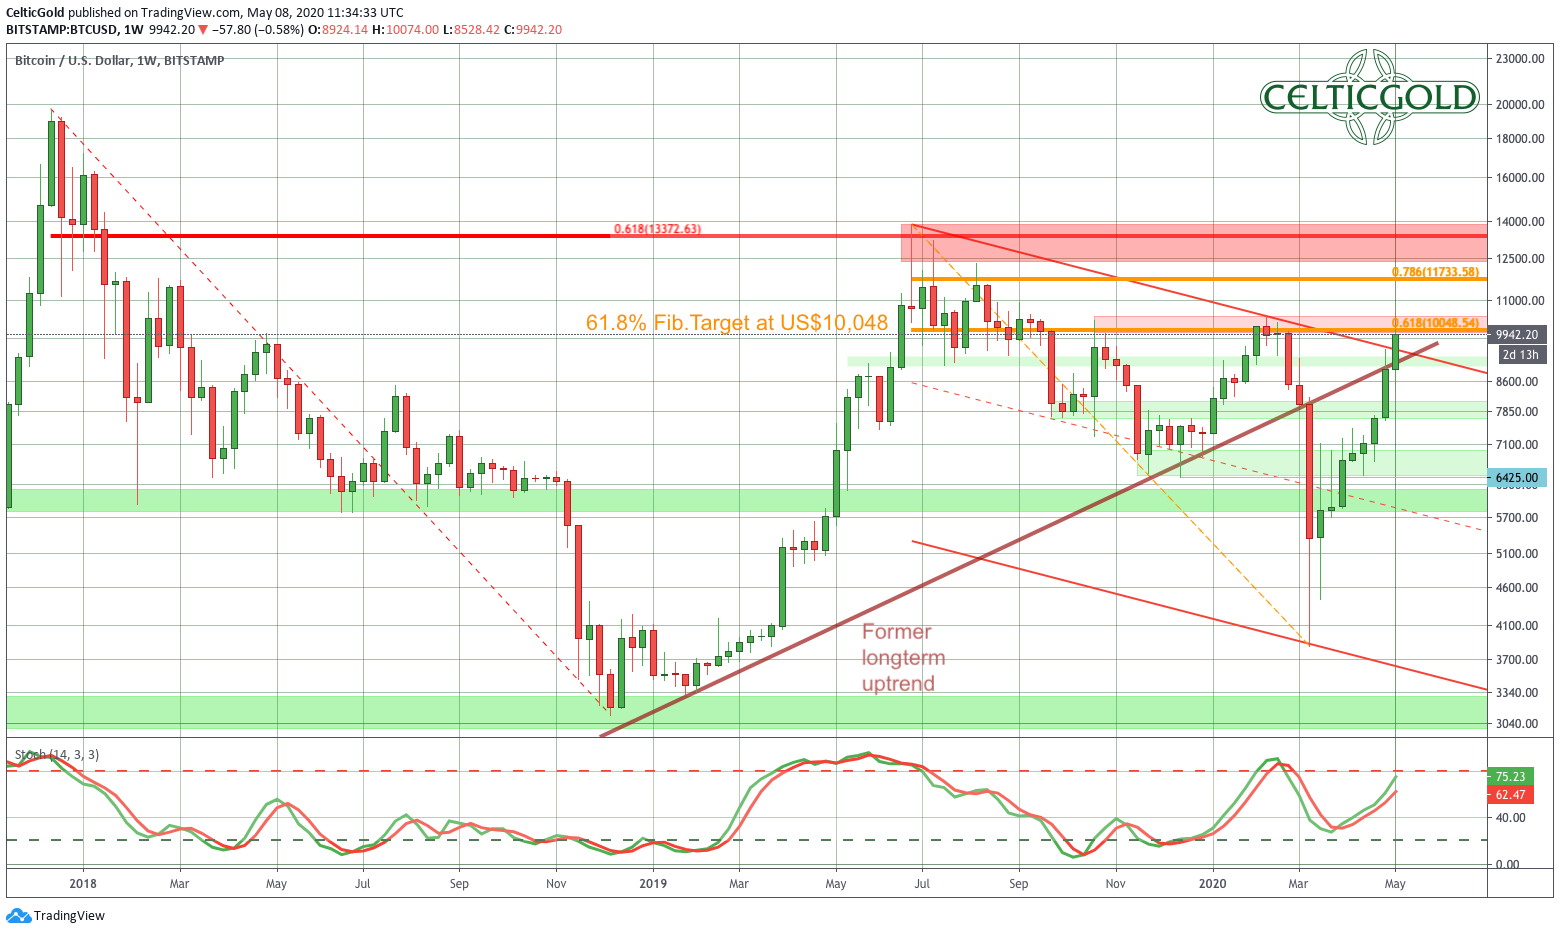
Bitcoin Weekly Chart, Source: Tradingview
Since its low of just under US$3,800 on March 12th, Bitcoin has risen by 160% to US$10,025 in the last eight weeks. This V-shaped recovery is currently taking Bitcoin to the longstanding former uptrend line from below. The break of this trend line caused the crash to US$3,800 two months ago. A direct breakout above this resistance was a surprise but has already happened. Another serious resistance has been the downward trend line of the last 10 months. Bitcoin jumped above this line without any problems just yesterday.
The next two Fibonacci retracements
The now realizing best case scenario has some more room to go. The 61.8% retracement at around US$10,050 and also the 78.6% retracement at US$11,733 are realistic targets. Even a direct rally towards the horizontal resistance zone between US$12,500 and US$13,800 has become a possibility. The stochastic oscillator is not yet overbought and is therefore not opposing this bullish scenario.
In summary, the weekly chart is bullish since the end of March. No reversal signals have been detected yet. Rather, the bulls still have room to move up to around US13,000.
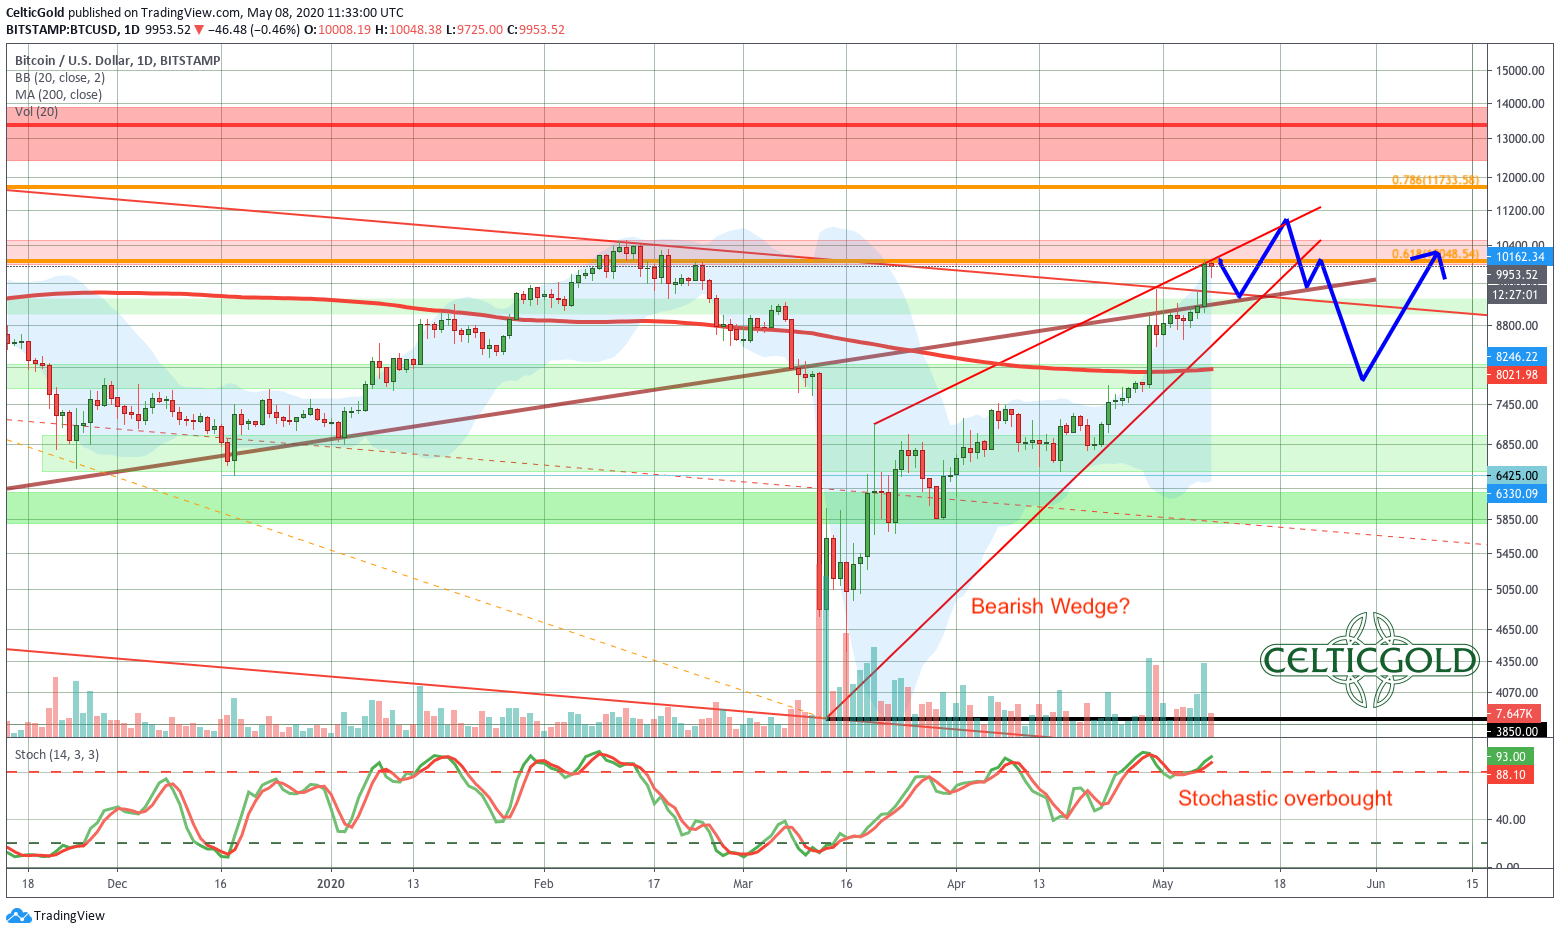
Bitcoin Daily Chart, Source: Tradingview
On the daily chart, the concentrated resistance zone around US$9,200 was obviously not a real obstacle. However, the chart is now overbought while bulls stretching the upper Bollinger Band. So far, there are no reversal signals yet and a continuation of the rally has the better prospects for the time being. Moreover, Bitcoin is known for its extreme movements, which often overrun many support or resistance zones in both directions. But of course, the risk/reward-ratio at the current level is extremely unfavorable for new long positions.
Overall the daily chart is still bullish, but also overbought. A continuation of the rally towards US$11,000 and higher seems possible. But the round psychological number US$10,000 could also see some profit taking and initiate a healthy pullback. Also, be aware that there is a looming bearish wedge developing. A pullback would already represent a good buying opportunity in the range between US$7,500 and US$7,700. In the short term, however, it is difficult to imagine larger price declines while halving is just a few days away.
Commitments of Traders Report For Bitcoin Futures
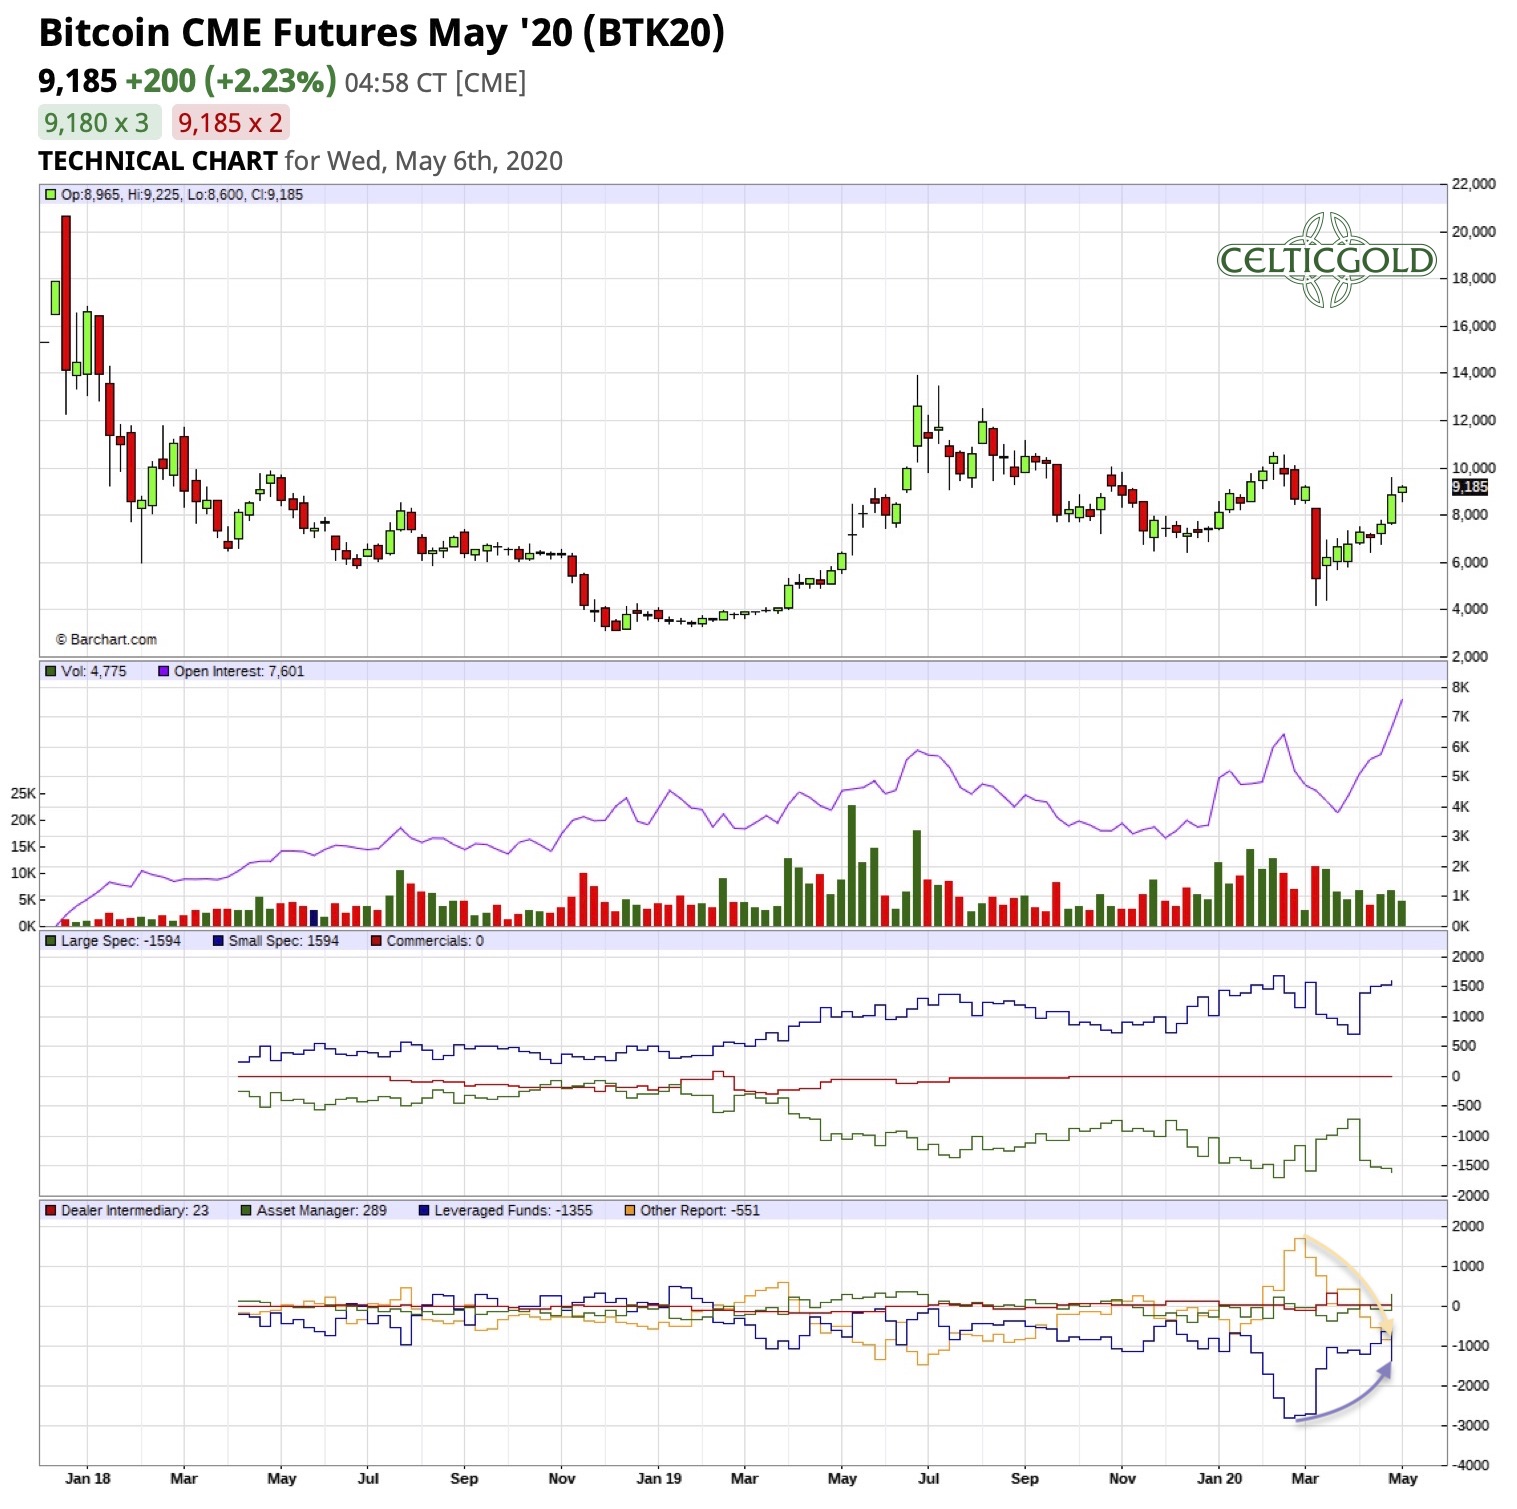
Bitcoin CME Future CoT-report, Source: Barchart
Since the high on February 13th at just under US$10,500, there have been significant shifts in the bitcoin futures market. The so-called “leveraged funds” were ideally positioned with an extraordinarily high short position for the crash in mid-March. Since the low below US$4,000, this group of market participants has quickly started to cover their shorts and recently achieved an almost neutral position. In the latest price increase above US$9,000, however, the “leveraged funds” have again slightly expanded their short position.
The subgroup of the so-called “Other Reportables” had distinguished itself with a very successful countercyclical approach over the past two years. This time, however, this group entered the correction rather procyclically with a high long position. In the meantime, however, a rather neutral position has also been achieved here.
Despite the wild movements, the current CoT report is again neutral. None of the trader groups is currently taking an extreme position. Noticeable is the significantly increased “open interest”, which has more than doubled compared to the December lows.
Sentiment Bitcoin – Breakout In Progress
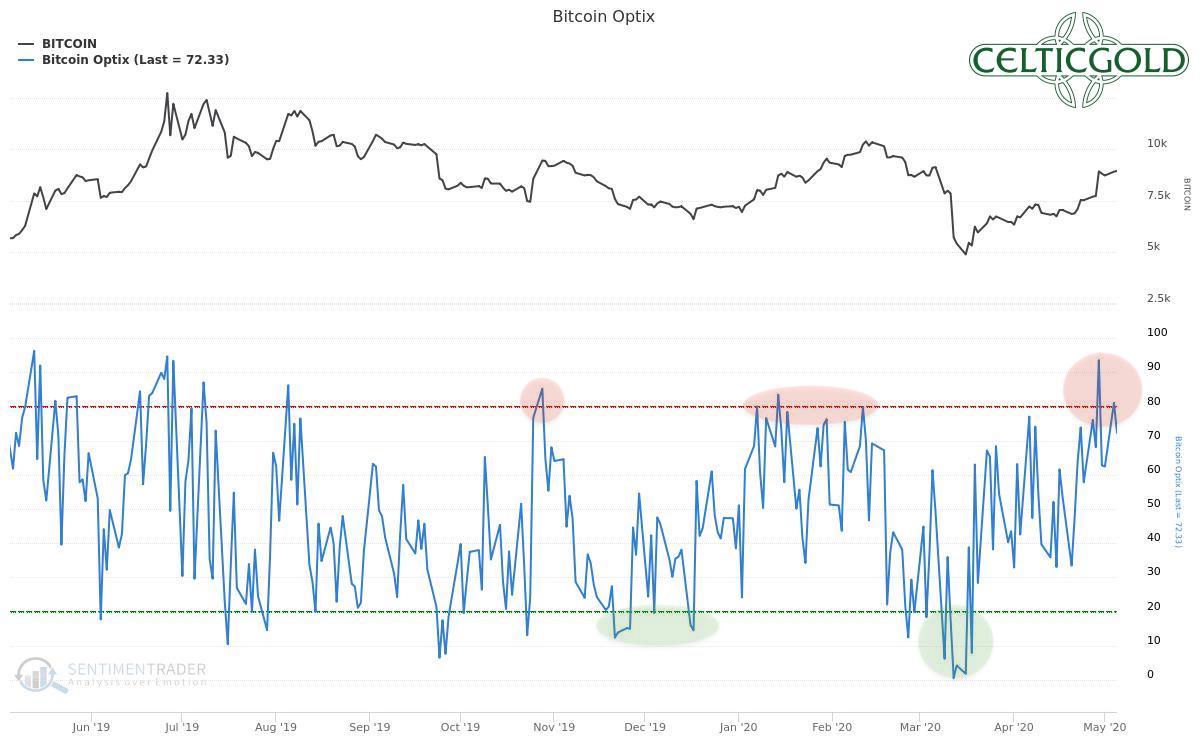
Bitcoin Optix as of May 6th, 2020. Source: Sentimentrader
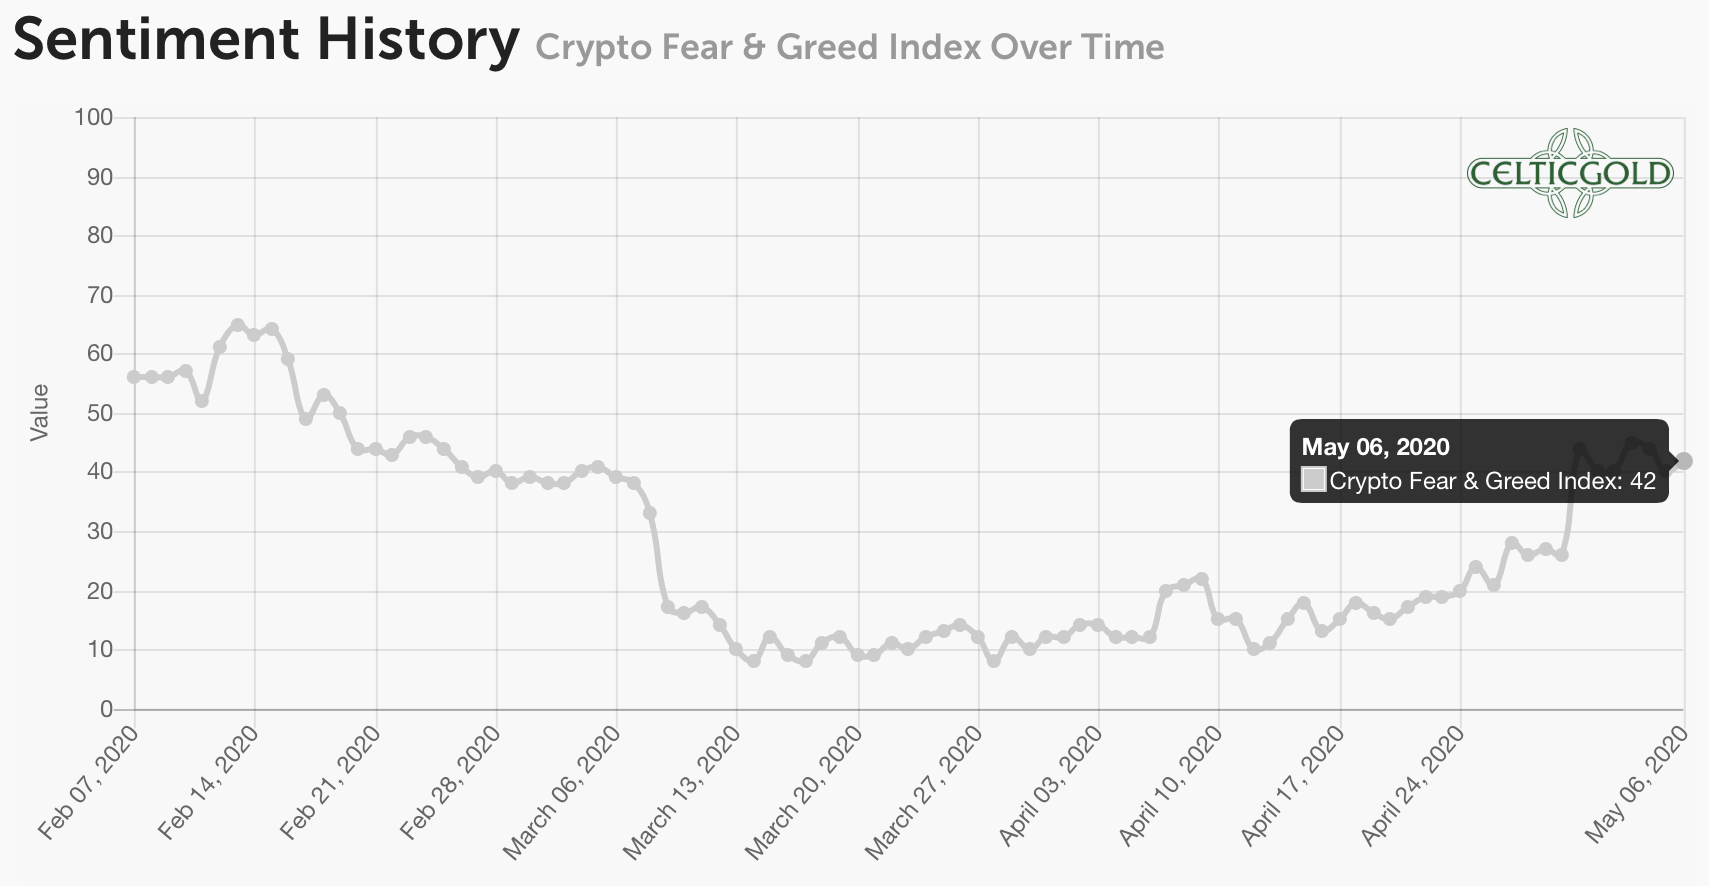
Crypto Fear & Greed Index as of May 6th, 2020. Source: Crypto Fear & Greed Index
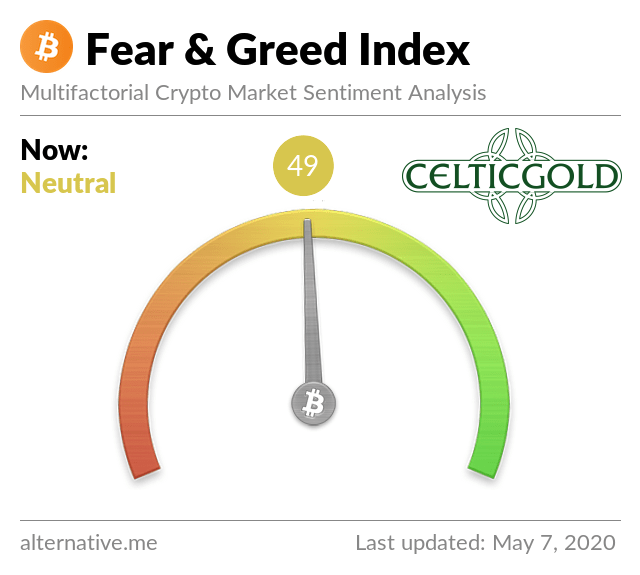
Crypto Fear & Greed Index as of May 7th, 2020. Source: Crypto Fear & Greed Index
In the short term the mood for bitcoin seems a little bit too optimistic as the Bitcoin Optix of Sentimentrader has measured extreme values for the first time since mid-February. In the medium and longer term, however, no exaggeration can be detected in sentiment. Rather, the sophisticated “Fear & Greed Index” is still sitting in its neutral zone with a recent value of 49.
In summary, sentiment provides a warning signal in the very short term. However, in the bigger picture the mood in the crypto world is far from being a big party, therefore any pullback in bitcoin should represent another buying opportunity. The “sentiment analysis module” thus produces the recommendation “buy the next dip”.
Seasonality Bitcoin
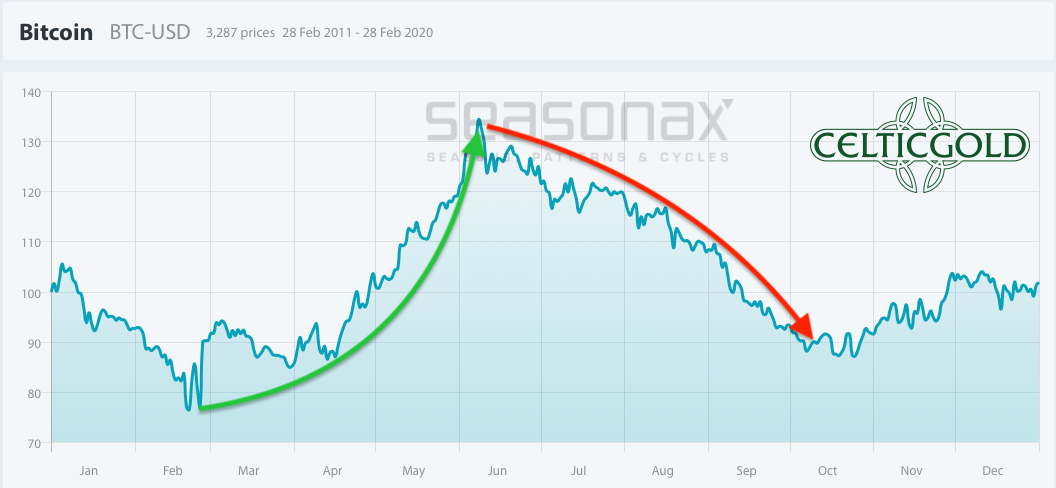
Bitcoin seasonality. Source: Seasonax
Based on the evaluation of the last nine years, bitcoin has developed a fairly clear seasonal pattern, which certainly is a useful tool for general timing. In fact, this statistical pattern seems to be working quite well so far this year as bitcoin started a new wave up in mid of March. According to the seasonal pattern, this rally could extend into June, before a corrective wave would take place over the summer months.
The seasonal component has been favorable since the end of February and supports rising bitcoin prices into early summer.
Bitcoin Against Gold
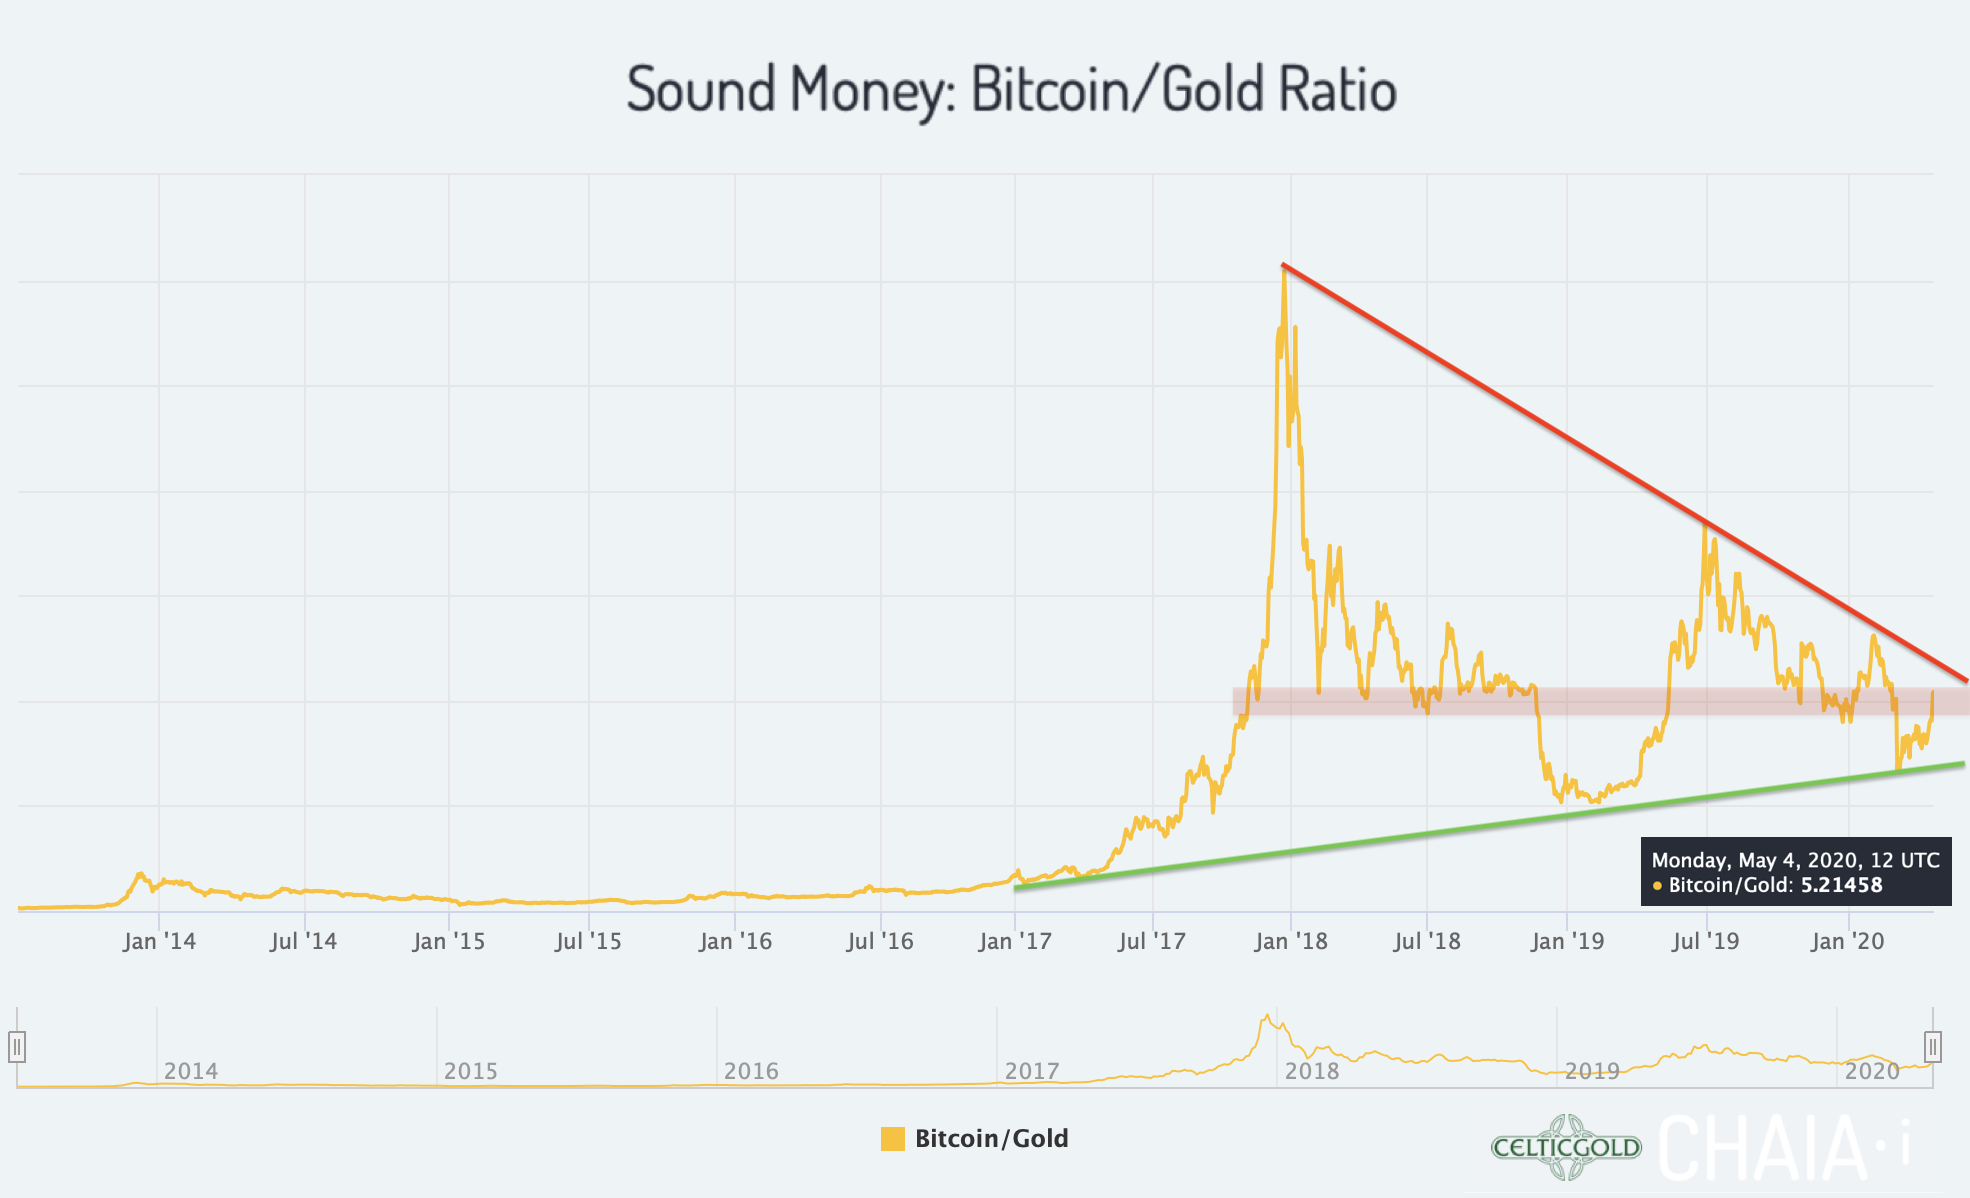
Sound Money Bitcoin/Gold-Ratio as of May 4th, 2020. Source: Chaia
Currently, you have to pay 5.74 ounces of gold for one single bitcoin. In other words, one troy ounce of gold currently costs only 0.174 bitcoin. Based on the numbers, bitcoin has hardly moved against gold since the beginning of this year. Nevertheless, in the last four months there have been strong movements in favor of both, gold and bitcoin. At the moment bitcoin has the tailwind again and is heading for the downtrend line of the last two and a half years. If there is an upward breakout from the triangle formation, the crypto winter should definitely be over for good and bitcoin should begin its journey towards its all-time highs at US$20,000. Bitcoin – Breakout In Progress!
Generally, buying and selling Bitcoin against gold only makes sense to the extent that one balances the allocation in the two asset classes! At least 10% and a maximum of 25% of one’s total assets should be invested in precious metals physically, while in cryptos and especially in Bitcoin one should hold at least 1% and a maximum of 5%. If you are very familiar with cryptocurrencies and Bitcoin, you can certainly allocate higher percentages to Bitcoin on an individual basis. For the average investor, who is normally also invested in equities and real estate, 5% in the highly speculative and highly volatile bitcoin is already a lot!
Gold and Bitcoin are like Yin and Yang
From a spiritual point of view, think of bitcoin and gold as another expression of our dualistic world. As we have sun and moon, summer and winter, warm and cold all representing various forms of Yin and Yang, it also makes sense to have an analog safe haven (gold) and a digital safe haven (bitcoin) in the 21st century. You want to have both!
Conclusion: Bitcoin – Breakout In Progress
In the longer term, the events of the last two and a half months are without any doubt extremely bullish for bitcoin. A brutal wave of insolvencies could not only turn our economic world upside down, but also fundamentally change the entire financial system! The biggest stimuli ever seen from governments and central banks have already shaken confidence in the fiat money systems to their very foundations. More and more people are realizing that government and money must be separated and that fiat money systems are responsible for the unfair distribution of opportunities and the unrestrained and undisciplined waste of the planet’s natural resources.
© Holger Zschaepitz @Schuldensuehner, 5th of May 2020
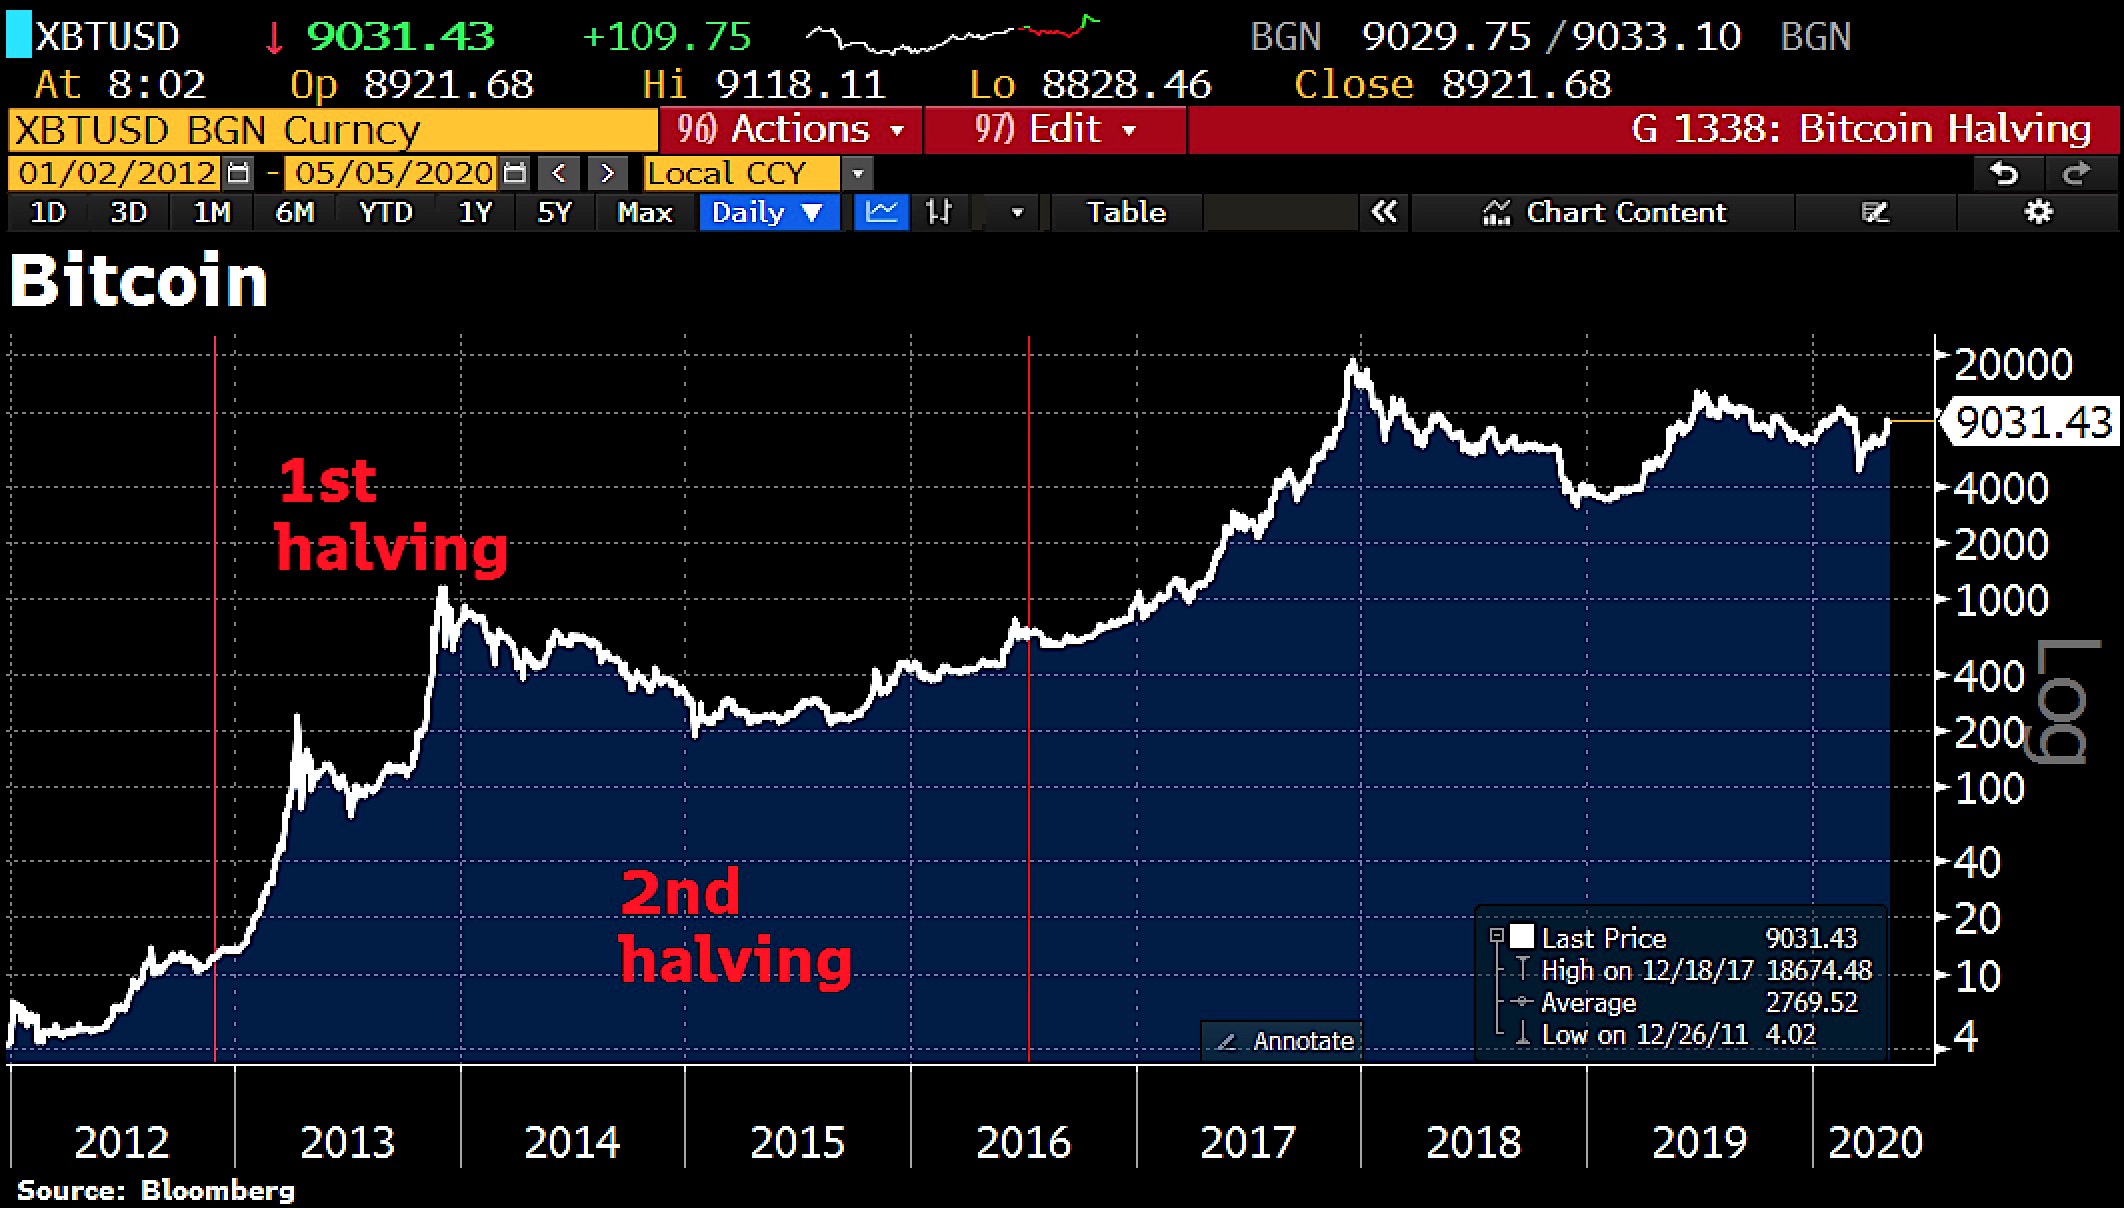
In addition to this already bullish mixture, the 3rd bitcoin halving will happen in just a few days. The first two bitcoin Halvings were each followed by an extreme rally and increases of 10,000% and 2,500% within one to two years!
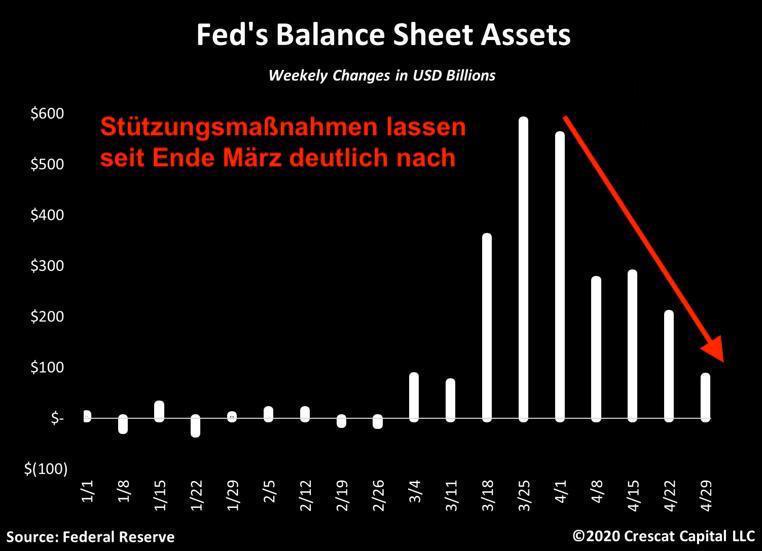
©Tavi Costa @Crescant Capital, April 29th 2020
However, a further deflationary phase in the markets cannot yet be completely ruled out. In fact, the situation is far too complex to blindly bet on inflation and hyperinflation at this stage. Recently, central banks have significantly reduced their support measures. But well over US$50 trillion have been destroyed worldwide by the corona crash. At the same time the money supply expansions could be sufficient to send gold and bitcoin into the stratosphere. But another deflationary wave or crash in the equity markets would affect gold and bitcoin too. On top, Gold and bitcoin are overbought and don’t deliver a good risk reward ratio in the short-term. Yes, any dip or pullback in these two markets needs to be bought!
Overall, our headline “Bitcoin – Breakout In Progress” is justified as bitcoin is leaving a strong impression these days. The breakout above the two resistance lines seems indeed to be successful and prices have reached US$10,000. From here, bitcoin only needs to double to reach its all-time high. Anyone who has studied bitcoin knows how quickly a 100% rise can happen.
Nevertheless, it is important to proceed carefully and patiently. On the way up, there will always be setbacks and thus also buying opportunities. Such a one would already represent itself with a possible pullback towards US$7,700 at any time.
Analysis sponsored and initially published by www.celticgold.eu.
If you like to get regular updates on our gold model, precious metals and cryptocurrencies you can subscribe to our free newsletter.

