


Bitcoin – In The Midst Of An Epic Liquidity Crisis
While the stock markets are falling in gaps like in 2001, the volatility index VIX is still rather acting like it would be in a bull market. Yet, commodities have been crashing like in a deflation, but treasury yields are trading around a 15-year high signaling inflation would be at 20%. On top, ultra-pessimistic sentiment is quickly shifting to super optimistic, yet generally reflecting complacency as if nothing is happening. Nothing seems to add up. Bitcoin – In the midst of an epic liquidity crisis.
Review
Until mid of August, all financial markets were able to recover euphorically in the context of the expected bear market rally in the summer. However, the last seven weeks brought strong pullbacks and new lows in almost all sectors. In this process, bitcoin (BTC-USD) also failed pretty much exactly at our 1st recovery target (25,000 USD) on August 15th at 25,212 USD and subsequently came back to 18,157 USD, losing more than 26%.
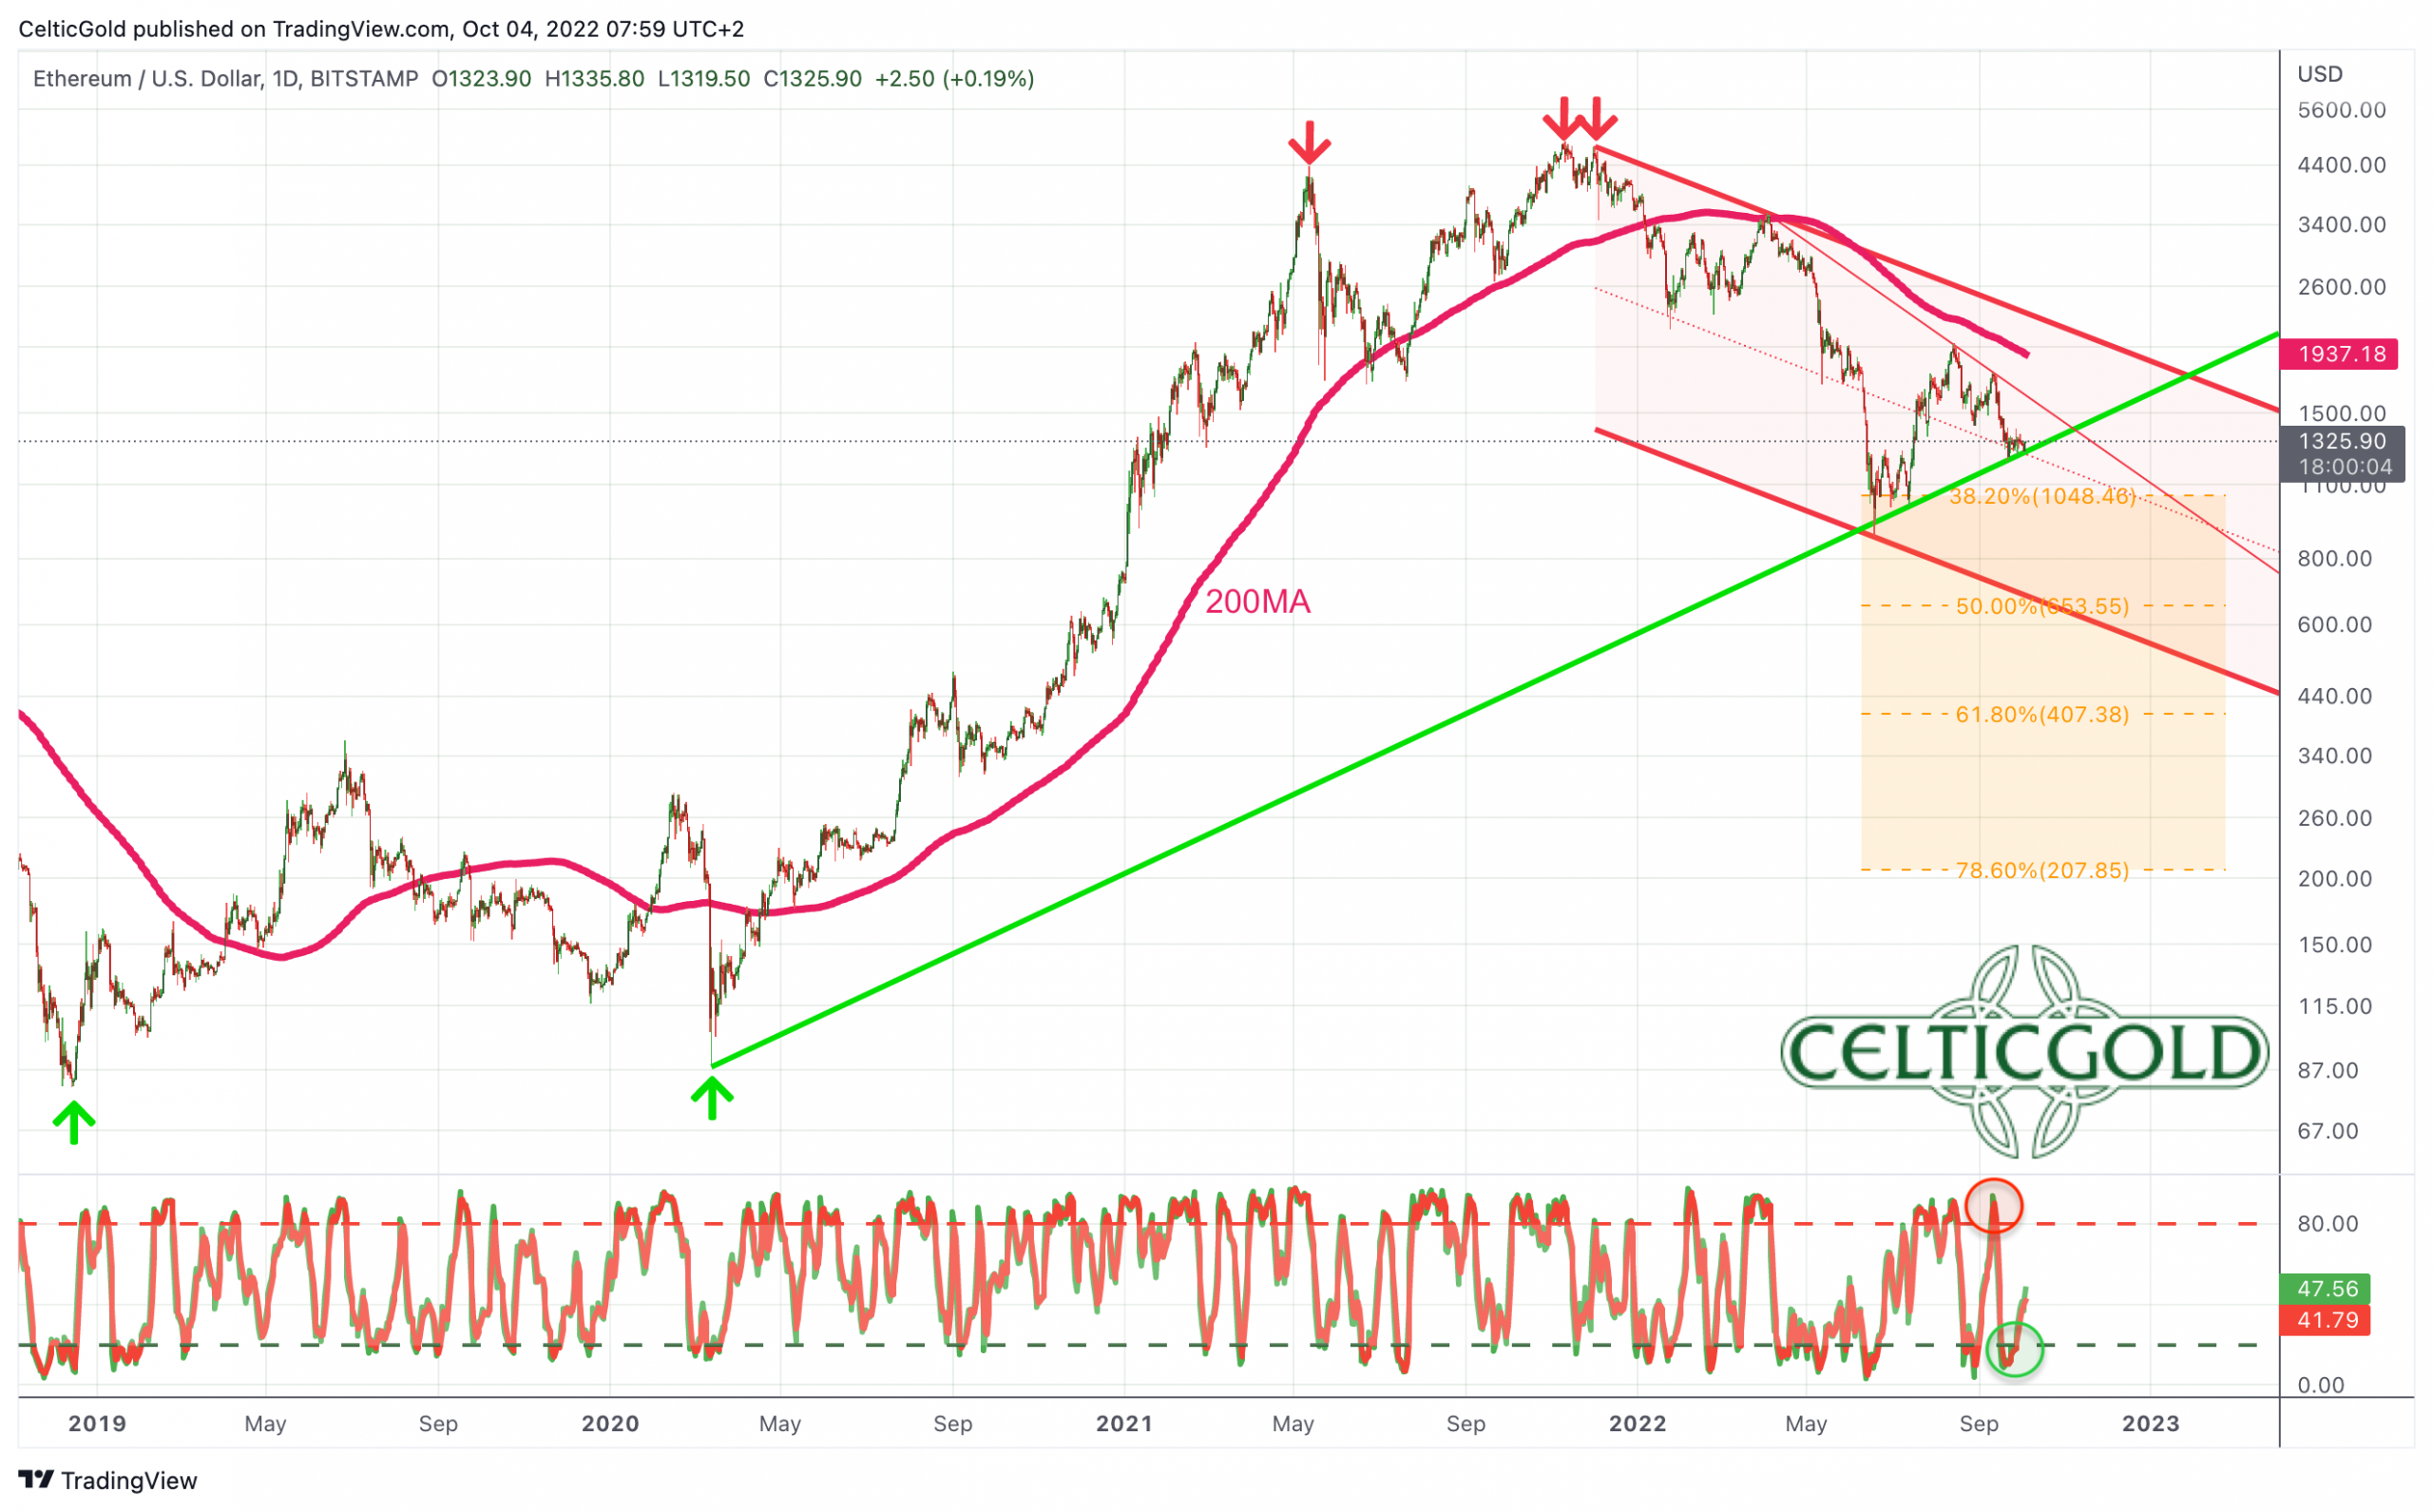
Ethereum in USD, daily chart as of October 4th, 2022. Source: Tradingview
Of course, Ethereum (ETH-USD) was unable to escape this selling pressure. Although the second-largest cryptocurrency was initially able to make significant gains in the run-up to the long-awaited “The Merge” event and clearly outperform bitcoin beforehand, the worsening liquidity crisis ultimately caused prices to fall again. Nevertheless, the last low from September 21st at 1,220 USD is still clearly above the low of June 18th at 881 USD!
The most significant scientific IT technology achievement of all time
Fundamentally, the Ethereum Merge was one of the largest open-source software projects and thus probably the most significant scientific IT technology achievement of all time. In the process, the consensus mechanism on the Ethereum blockchain was changed from an enormously energy-intensive “Proof-of-Work (PoW)” to an almost energy-free “Proof-of-Stake (PoS).” This has forever changed both, the way Ethereum is generated and as well the way transactions are validated on the Ethereum network. The main promise here is massive environmental benefits. According to a tweet from Ethereum creator Vitalik Buterin, Merge will reduce global energy consumption by 0.2%!
Optimists now expect that because of this, not only could more institutional investors get on board, but more importantly, many more good protocols and dapps will be built on the Ethereum network, providing decentralized security and real value to the Ethereum ecosystem.
Pessimists, on the other hand, argue that The Merge will have no impact on the insanely high transaction fees (gas). Moreover, the SEC (United States Securities and Exchange Commission) may soon consider Ethereum a security to be regulated due to the staking mechanism introduced. In that case, 99% of the U.S. population would no longer be able to legally trade Ethereum on an exchange.
Hence, in the midst of a deep crypto winter, the situation continues to come to a head, and not just in terms of liquidity and charts. Rather, the threat of regulation (Ethereum) on the part of the SEC and the approaching Mt. Gox compensation payments (bitcoin) are hanging like a sword of Damocles over the prices of bitcoin and Ethereum and the crypto sector in general.
Technical Analysis For Bitcoin in US-Dollar
Bitcoin Weekly Chart – Clearly defined downtrend channel
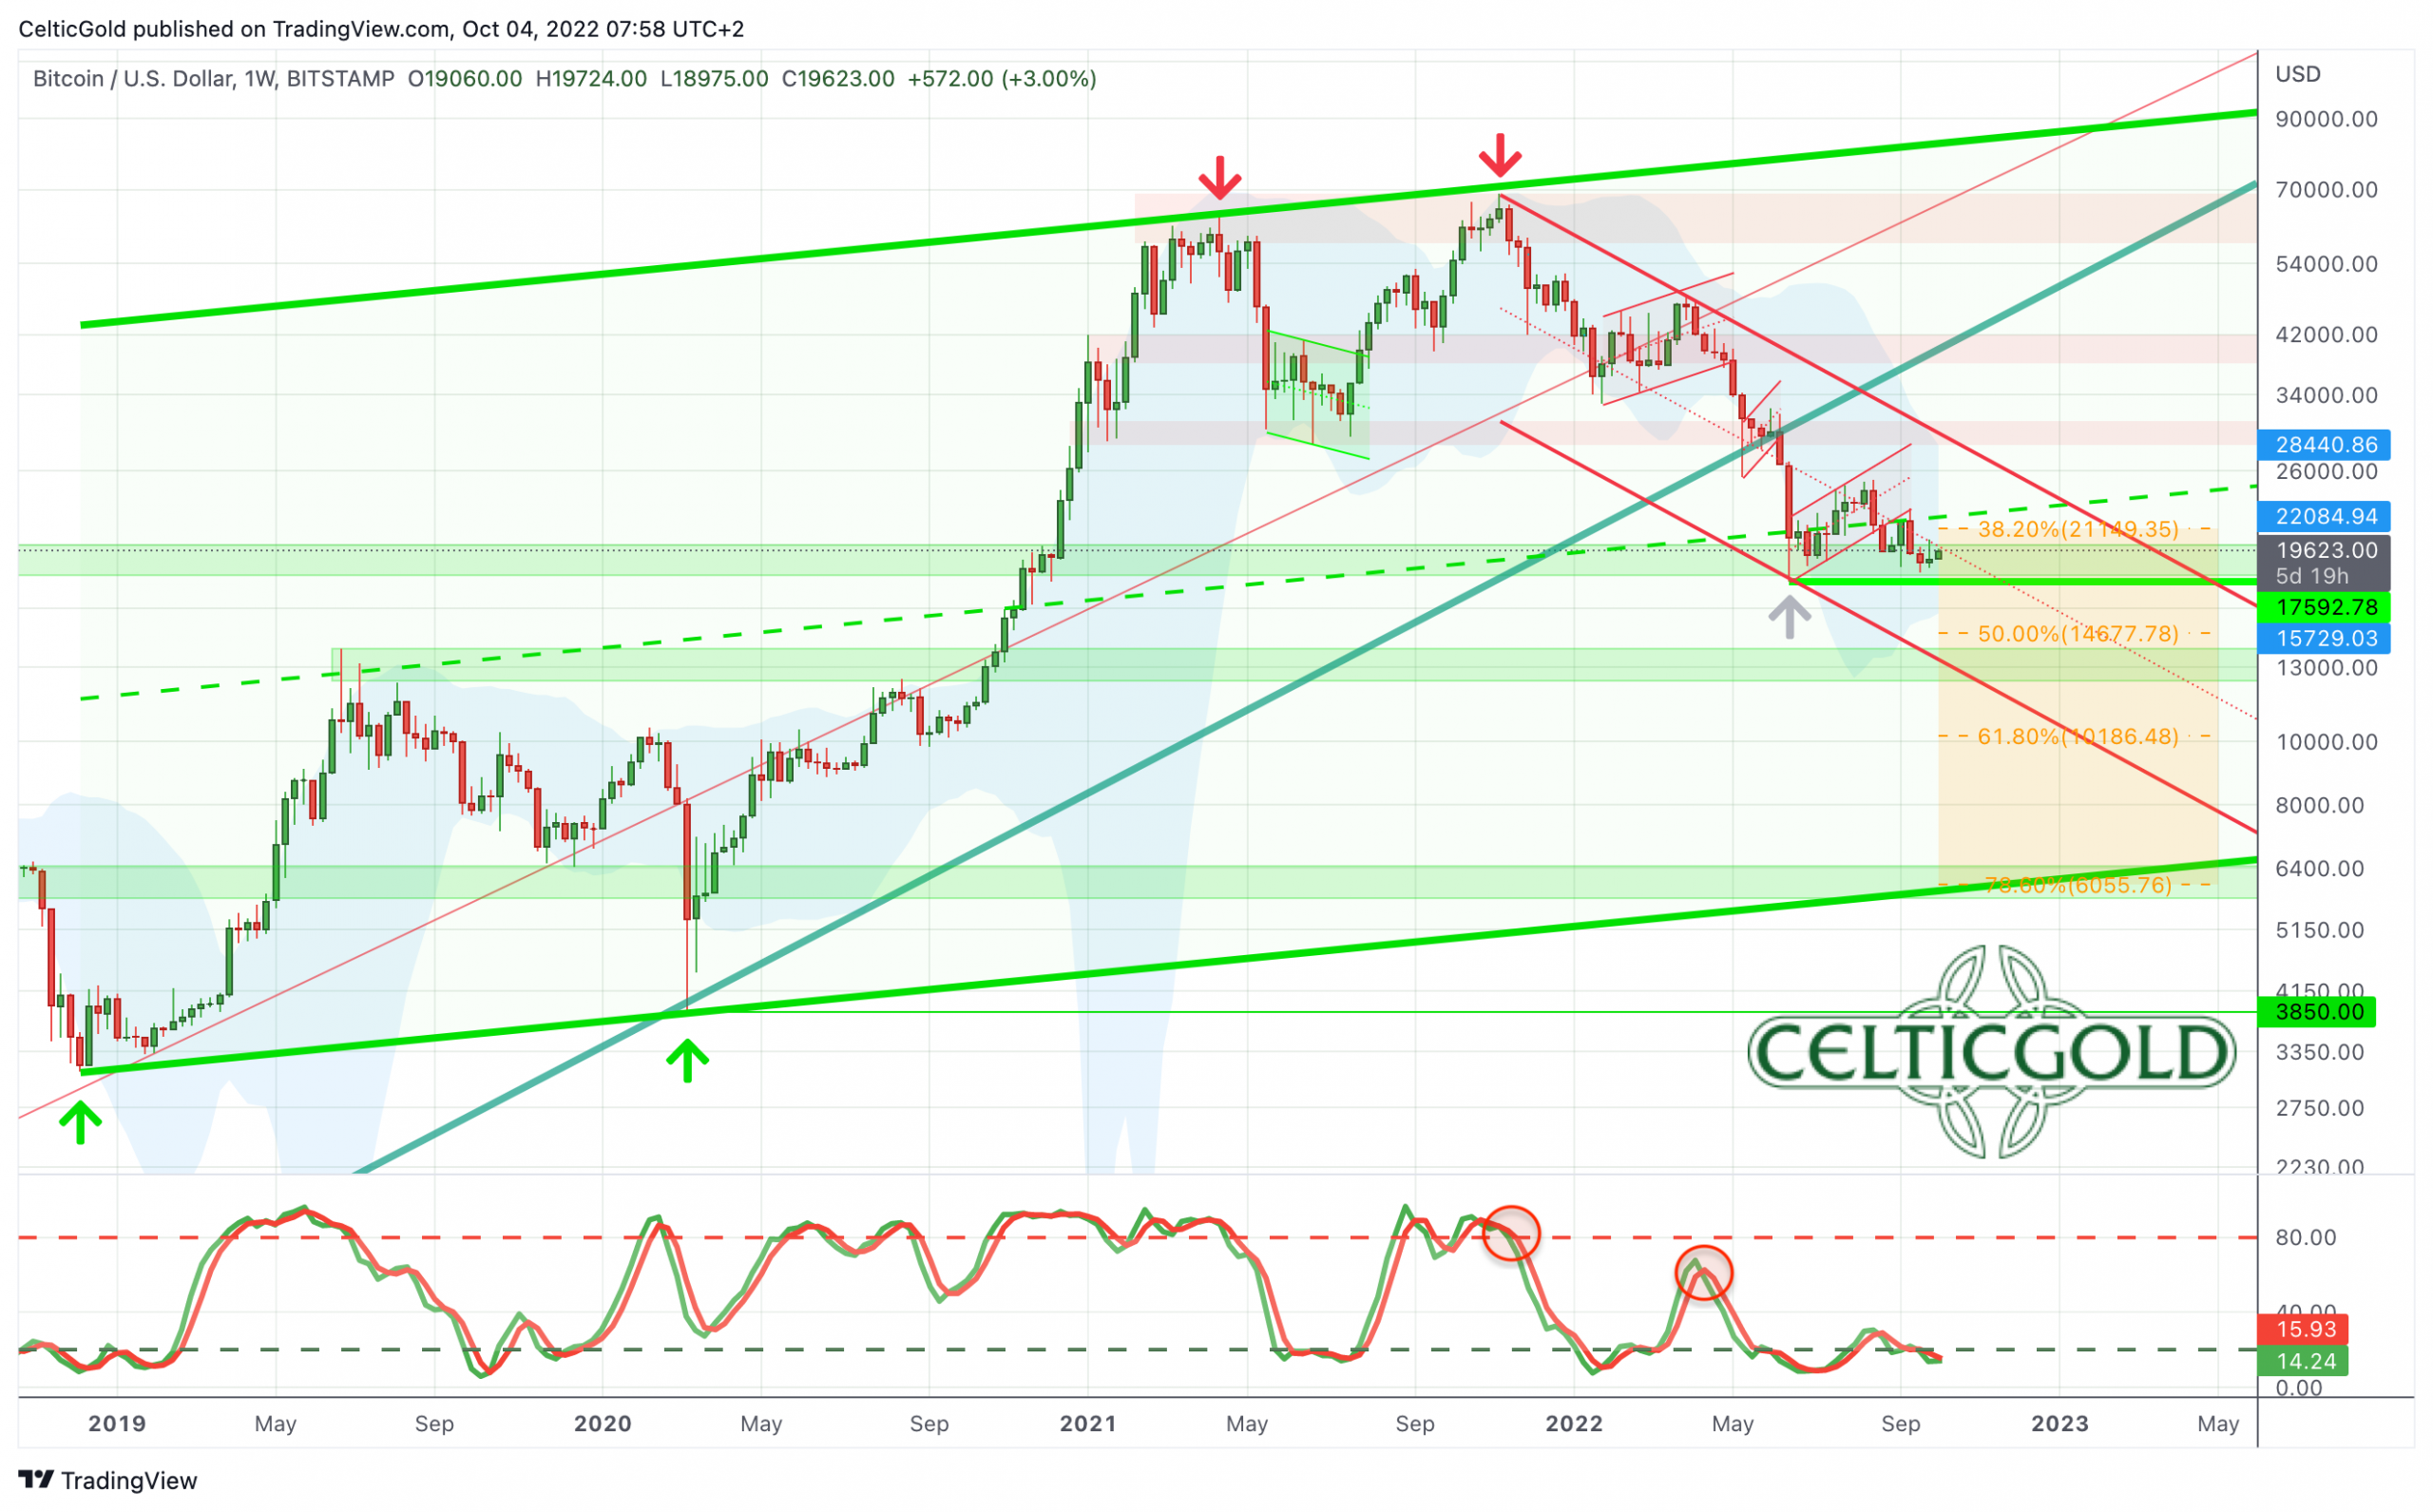
Bitcoin in USD, weekly chart as of October 4th, 2022. Source: Tradingview
Within the clearly defined downtrend channel, bitcoin prices have been moving lower for the last ten and a half months. All intermediate recoveries went nowhere and actually failed even at the smallest resistances. Since the all-time high in November 2021, bitcoin has never been able to reach its upper Bollinger band (29,788 USD) on the weekly chart again. Currently, prices consolidating within the support zone between about 18,000 USD and 20,000 USD. From here, a stabilization succeeded since mid of June, but a “three-month sideways torture” is a better description for this price action. Another breakout to the downside seems to be only a matter of time.
In the bigger picture, the lower edge of the large uptrend channel is currently sitting around 6,000 USD and would represent the not totally unrealistic “worst case scenario” for bitcoin. So far, bitcoin has only given back a bit more than the 38.2% retracement of the previous uptrend (from 3,125 to 69,000 USD). If support around 18,000 USD fails to hold, the next retracements would be at 14,677 USD (50%) and 10,186 USD (61.8%). However, on a weekly view, prices are likely to stay within the tightening Bollinger Bands between roughly speaking 16,000 USD and 28,000 USD.
Overall, the trend on the weekly chart clearly remains to the downside. However, given the oversold situation, sharp and jerky recovery moves (short squeeze) need to be factored in. Yet, an end to the crypto winter is not in sight and bitcoin is likely to see new lows in the medium term despite any intermediate recoveries and countertrend rallies.
Bitcoin Daily Chart – Blatant Weakness
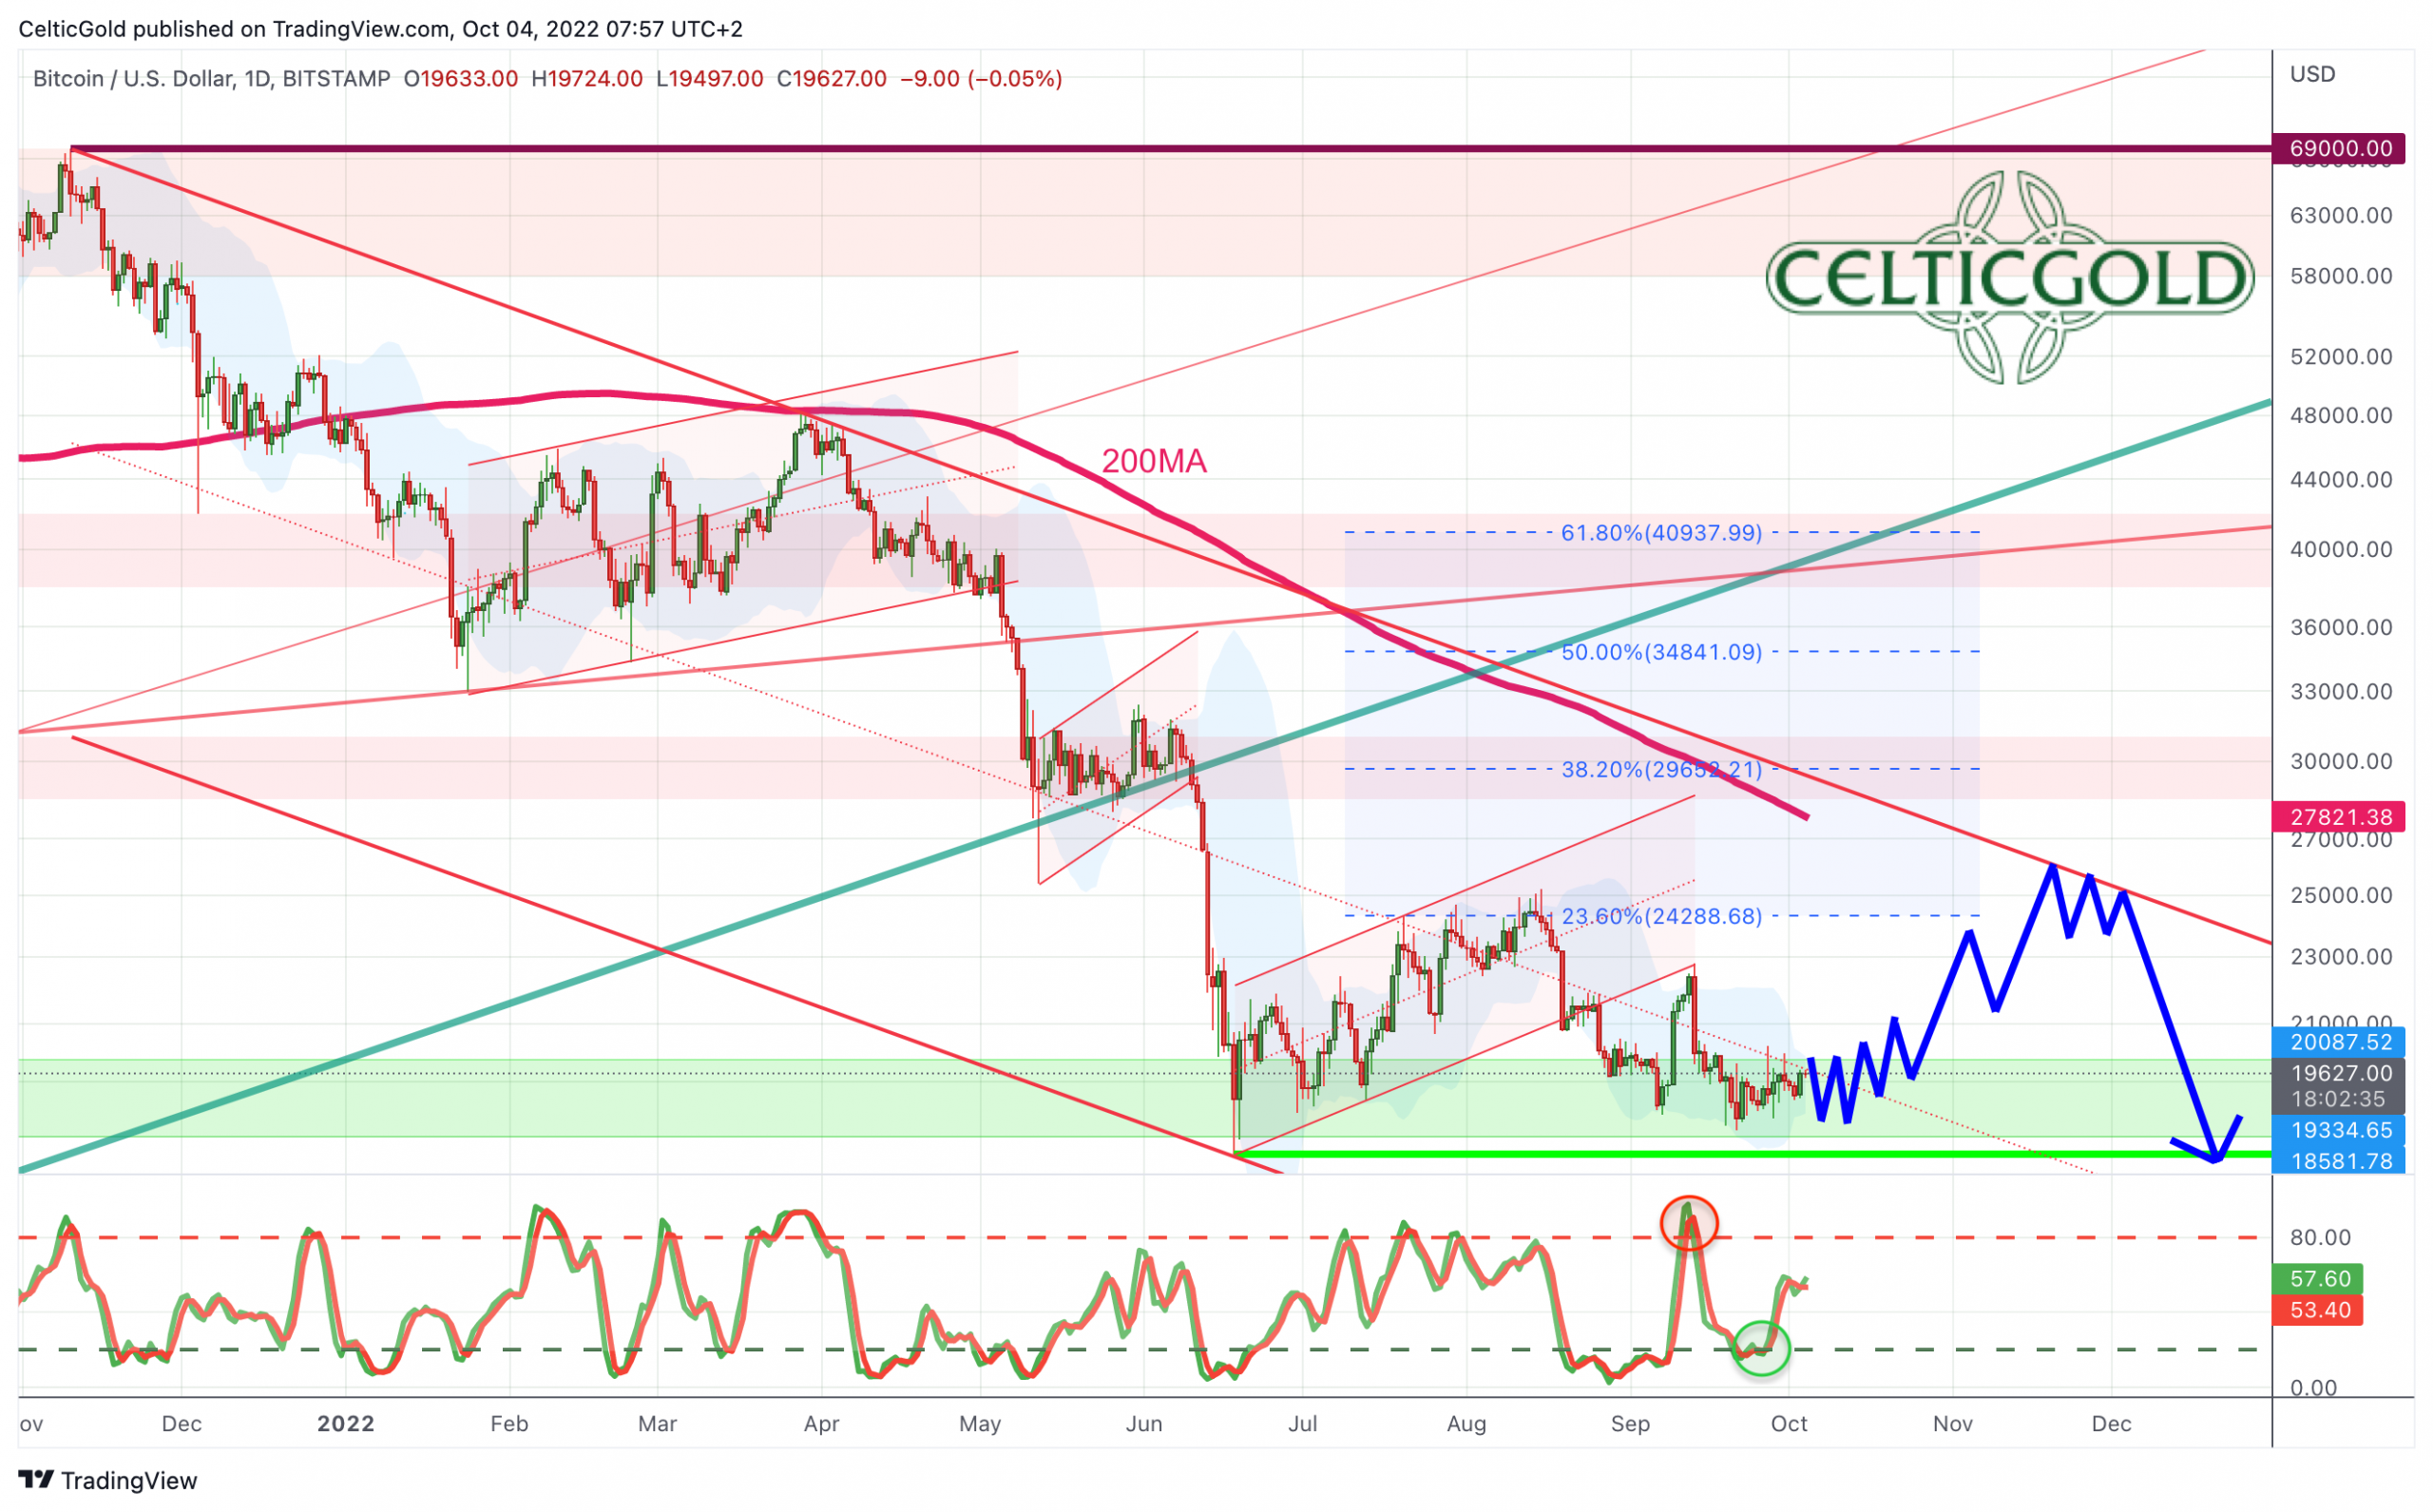
Bitcoin in USD, daily chart as of October 4th, 2022. Source: Tradingview
The daily chart depicts bitcoin’s glaring weakness even better. Basically, it has been constantly going downhill since mid-November 2021. Of course, the larger situation is severely oversold, but the reaction to the entire downward movement was just enough for a recovery to the 23.6% retracement around 25,000 USD in midsummer. It can’t get any weaker than that. The 200-day moving average (27,821 USD) is also falling fast and represents the “best case scenario” for an ever-possible short squeeze.
In the very short term, bitcoin prices will most likely remain slightly under pressure but move sideways. The Bollinger bands have been narrowing a lot in recent weeks and it would not be a surprise if bitcoin simply fluctuates between 18,500 USD and 20,000 USD for some time. However, on the horizon of the next two to three months, a bounce or a year-end rally, however shaped, should succeed, as the situation is simply too oversold.
In summary, the daily chart is neutral to bearish. Prices have been moving sideways or slightly south for many weeks without much significance. As long as the U.S. Dollar remains strong, bitcoin will have a hard time to stage any sustainable rally. However, as soon as the U.S. Dollar will take the necessary breather, the whole crypto sector will start a recovery.
In the crypto winter of 2018, bitcoin rallied from 3,200 USD to 13,800 USD within just a few months. Hence, don’t be surprised if bitcoin rather quickly recovers by 50% only to give back all those gains in the following months.
Sentiment Bitcoin – In The Midst Of An Epic Liquidity Crisis
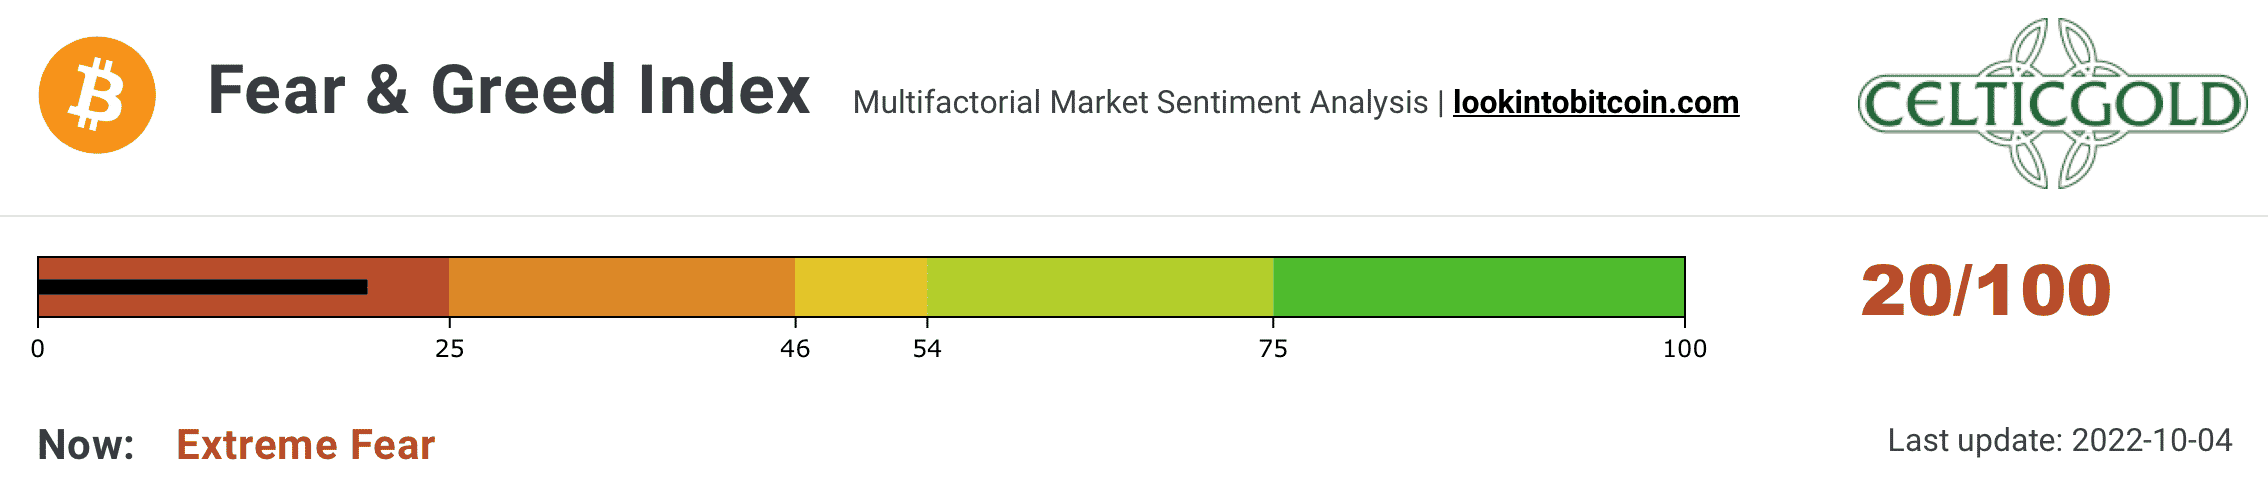
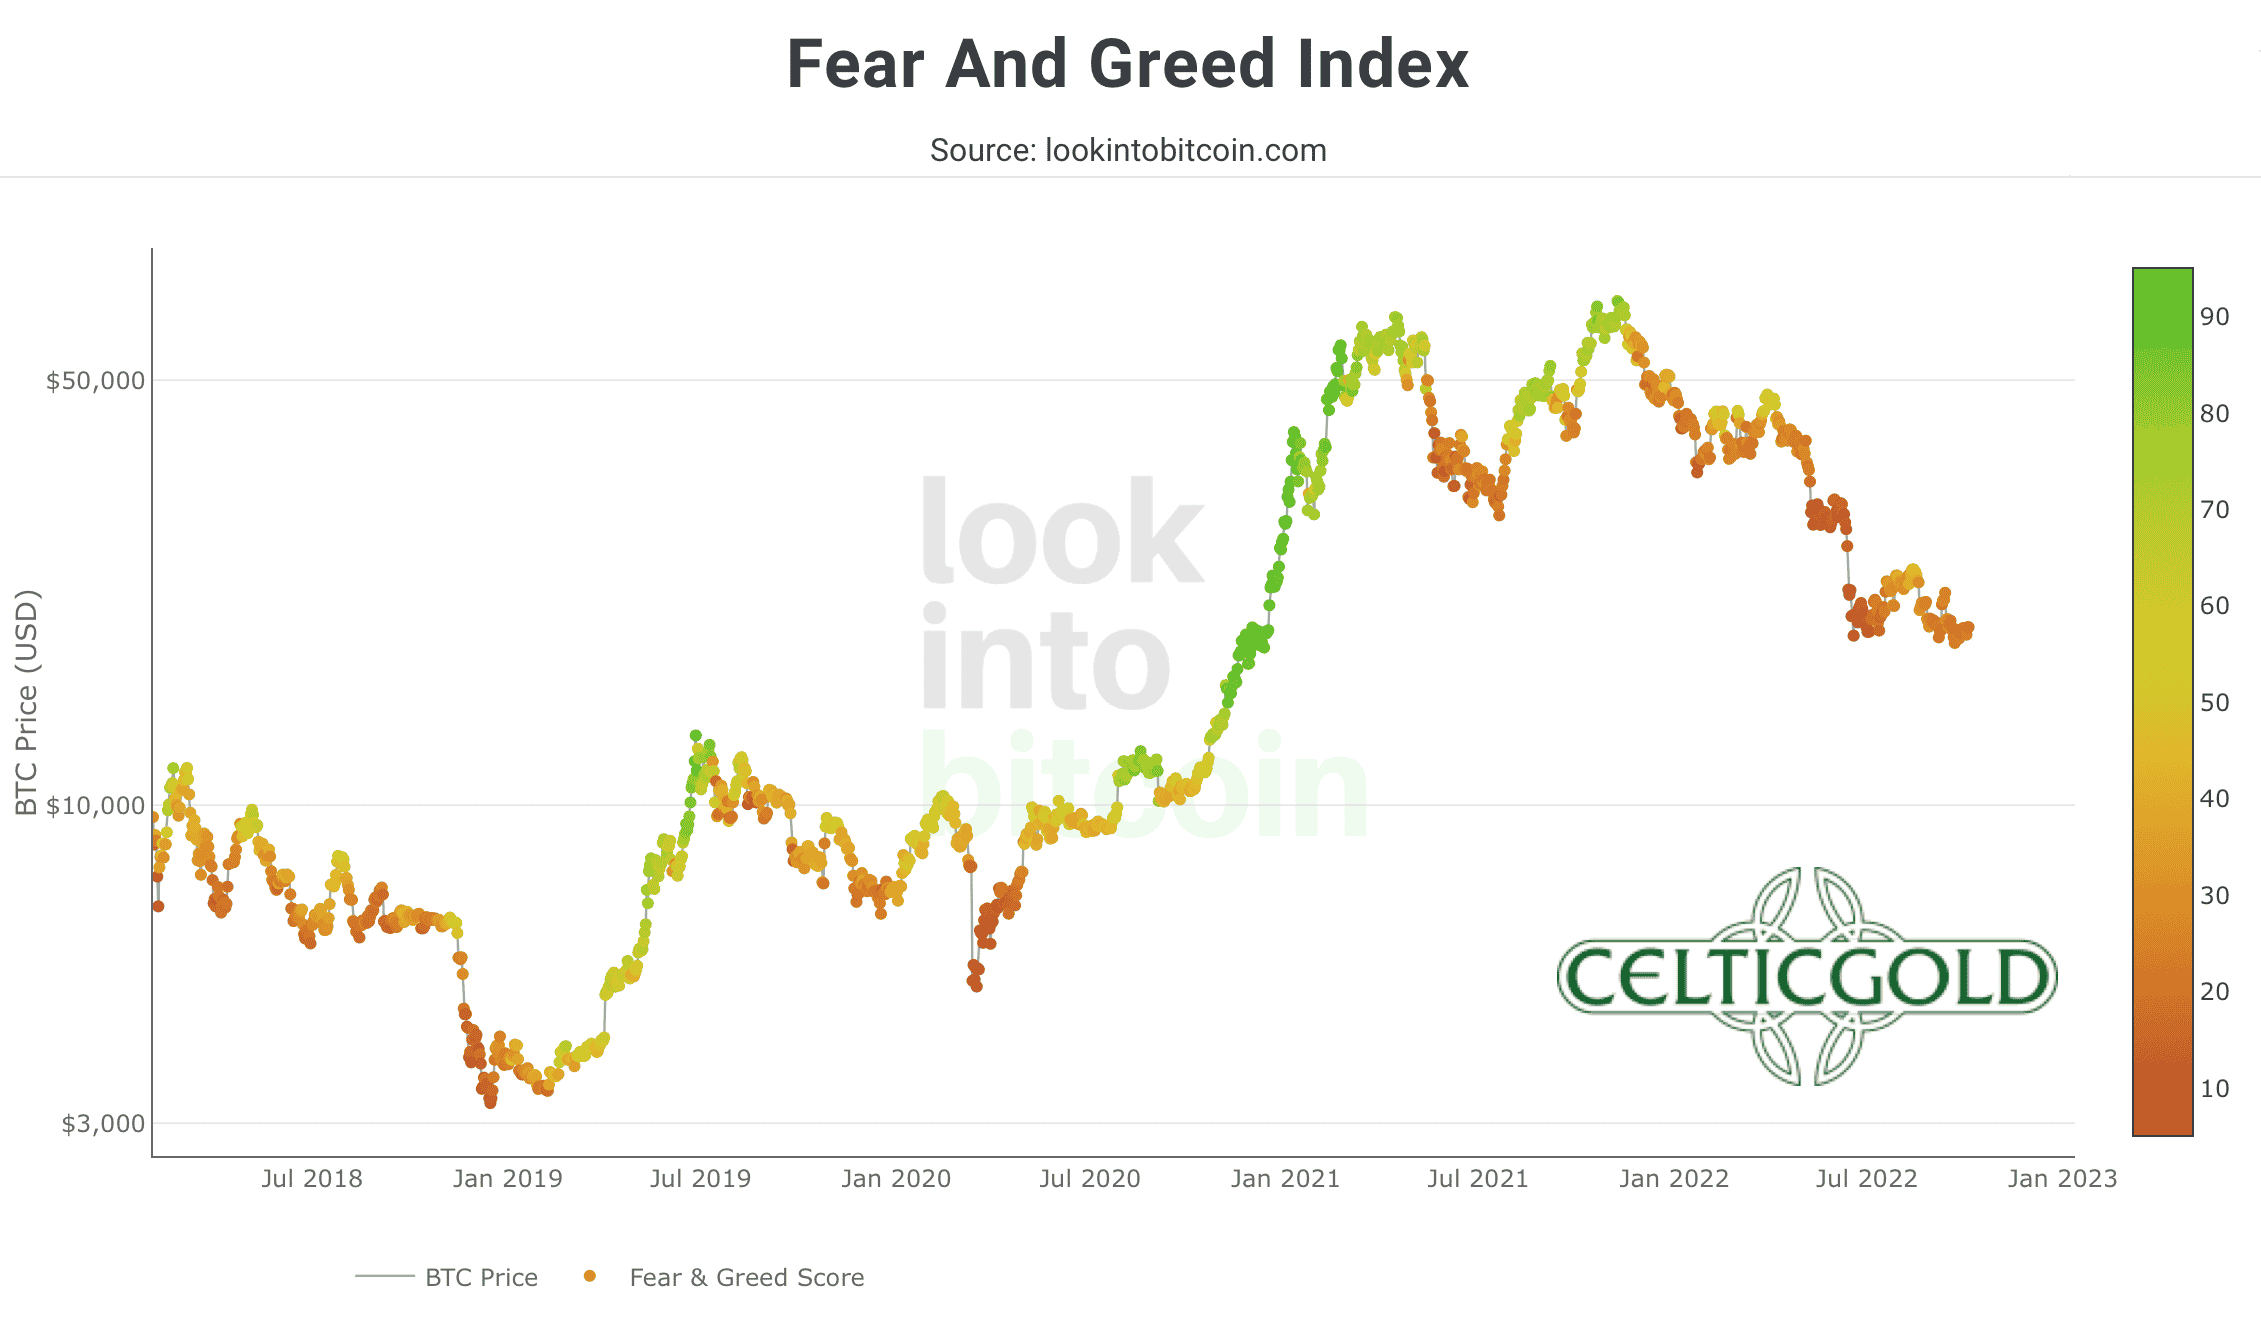
Crypto Fear & Greed Index, as of October 4th, 2022. Source: Lookintobitcoin
After recovering significantly in the summer, the Crypto Fear & Greed Index is back in panic mode. From a higher-level take, fear continues to run deep in the crypto sector and despite this prolonged phase of fear and panic, there are no signs of an immediate end to this.
Crypto Fear & Greed Index long term, as of October 4th, 2022. Source: Lookintobitcoin
In the bigger picture, the beaten down sentiment provides a contrarian opportunity for long-term investors and holders. And even though, it could still take a long time for such positions to move clearly into positive territory, at the very least, a strong bounce/recovery should succeed until year-end.
Overall, the fearful sentiment continues to provide a contrarian buy signal.
Seasonality Bitcoin – About To Turn Bullish
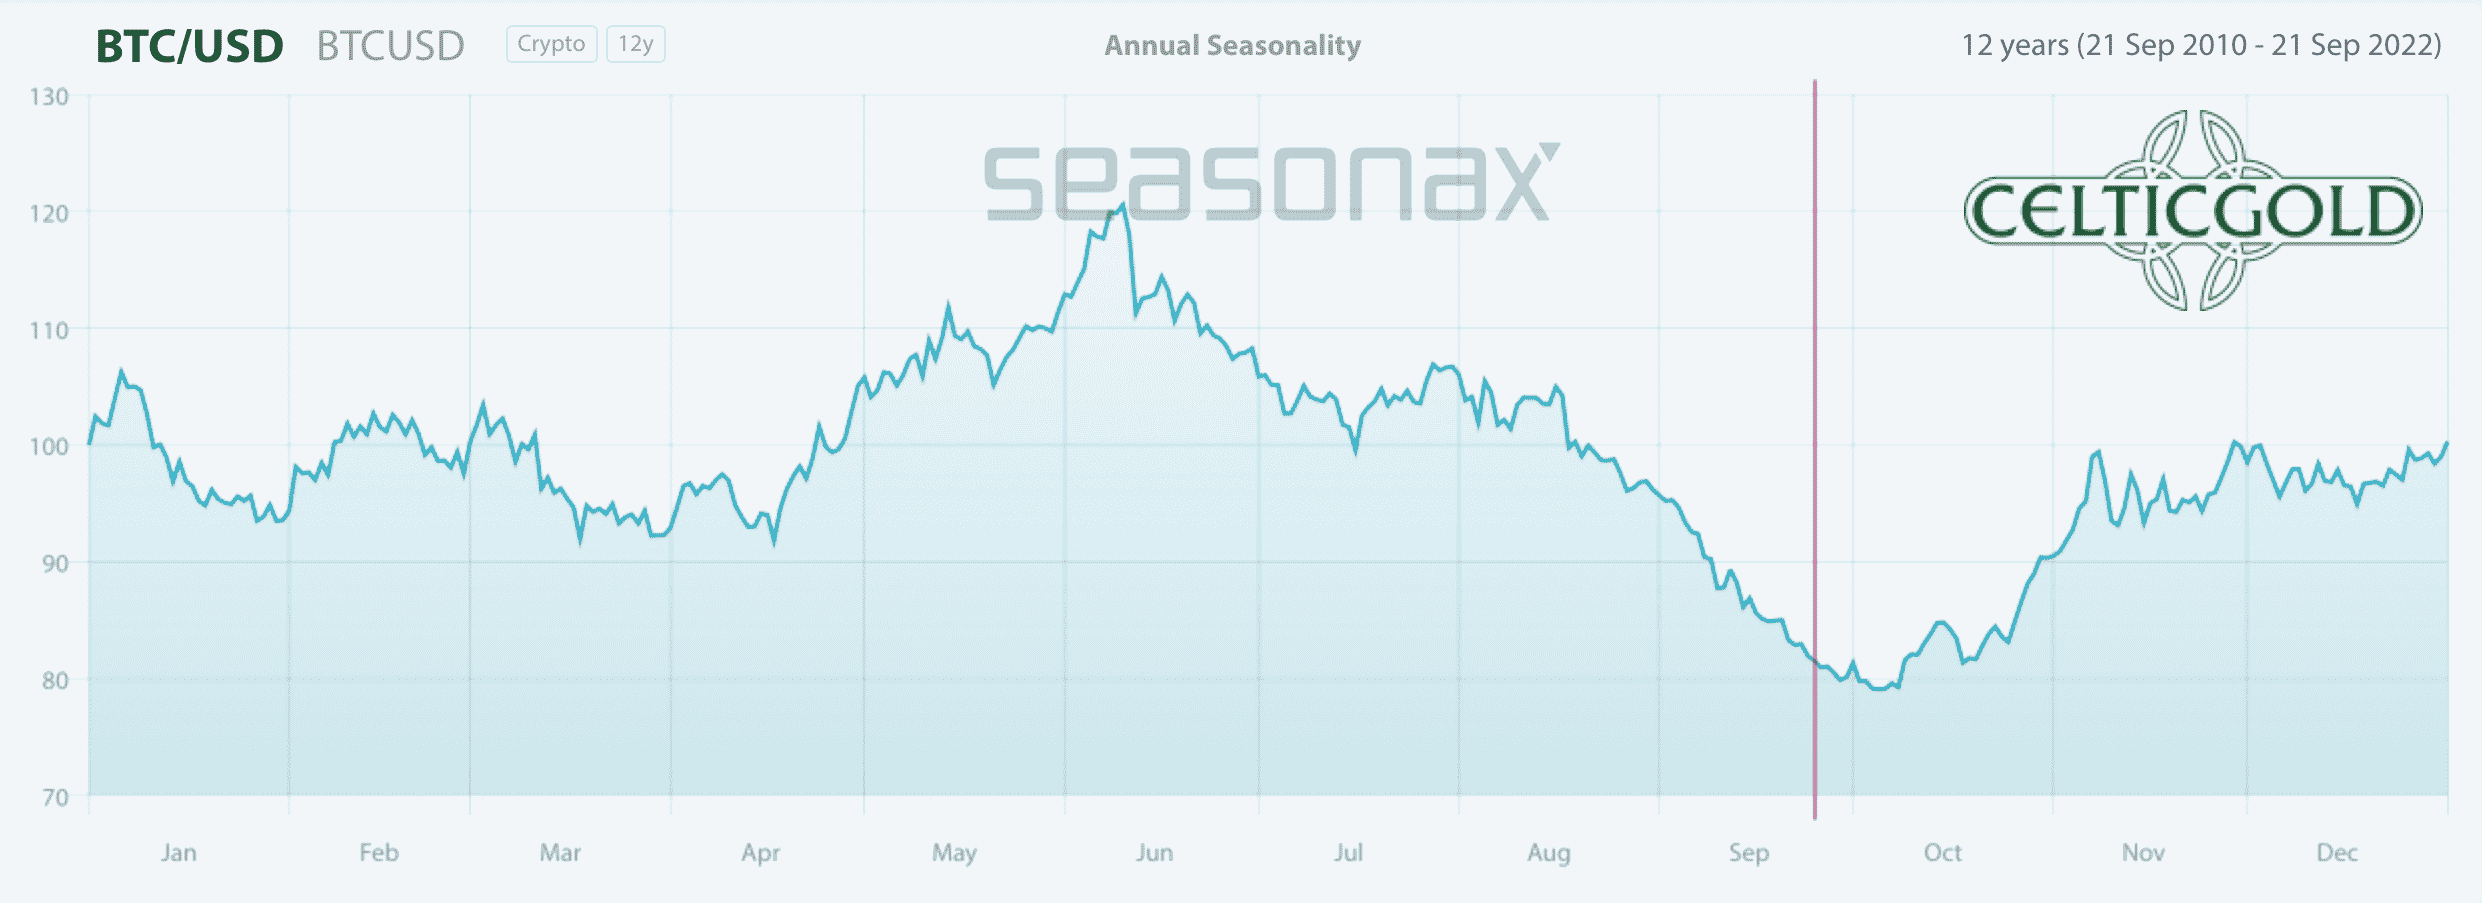
Seasonality for bitcoin, as of September 25th, 2022. Source: Seasonax
The poor seasonal pattern has been clearly confirmed in recent weeks. Statistically, however, a trend change is now on the horizon from early or mid-October. A major recovery move could therefore at least give the crypto sector a somewhat conciliatory end to this painful year. Until then, however, there could still be one to four difficult weeks ahead. But with the next FED interest rate decision on November 2nd and the “midterm elections” on November 8th, there are two events coming up that could at least provide for a temporary stabilization and possibly also the start of a year-end rally in the stock-market.
Overall, the seasonal component continues to call for patience. From mid-October, the situation brightens significantly from a statistical point of view, and the chances of a recovery are relatively high given the bombed-out sentiment and the oversold situation.
Sound Money: Bitcoin vs. Gold
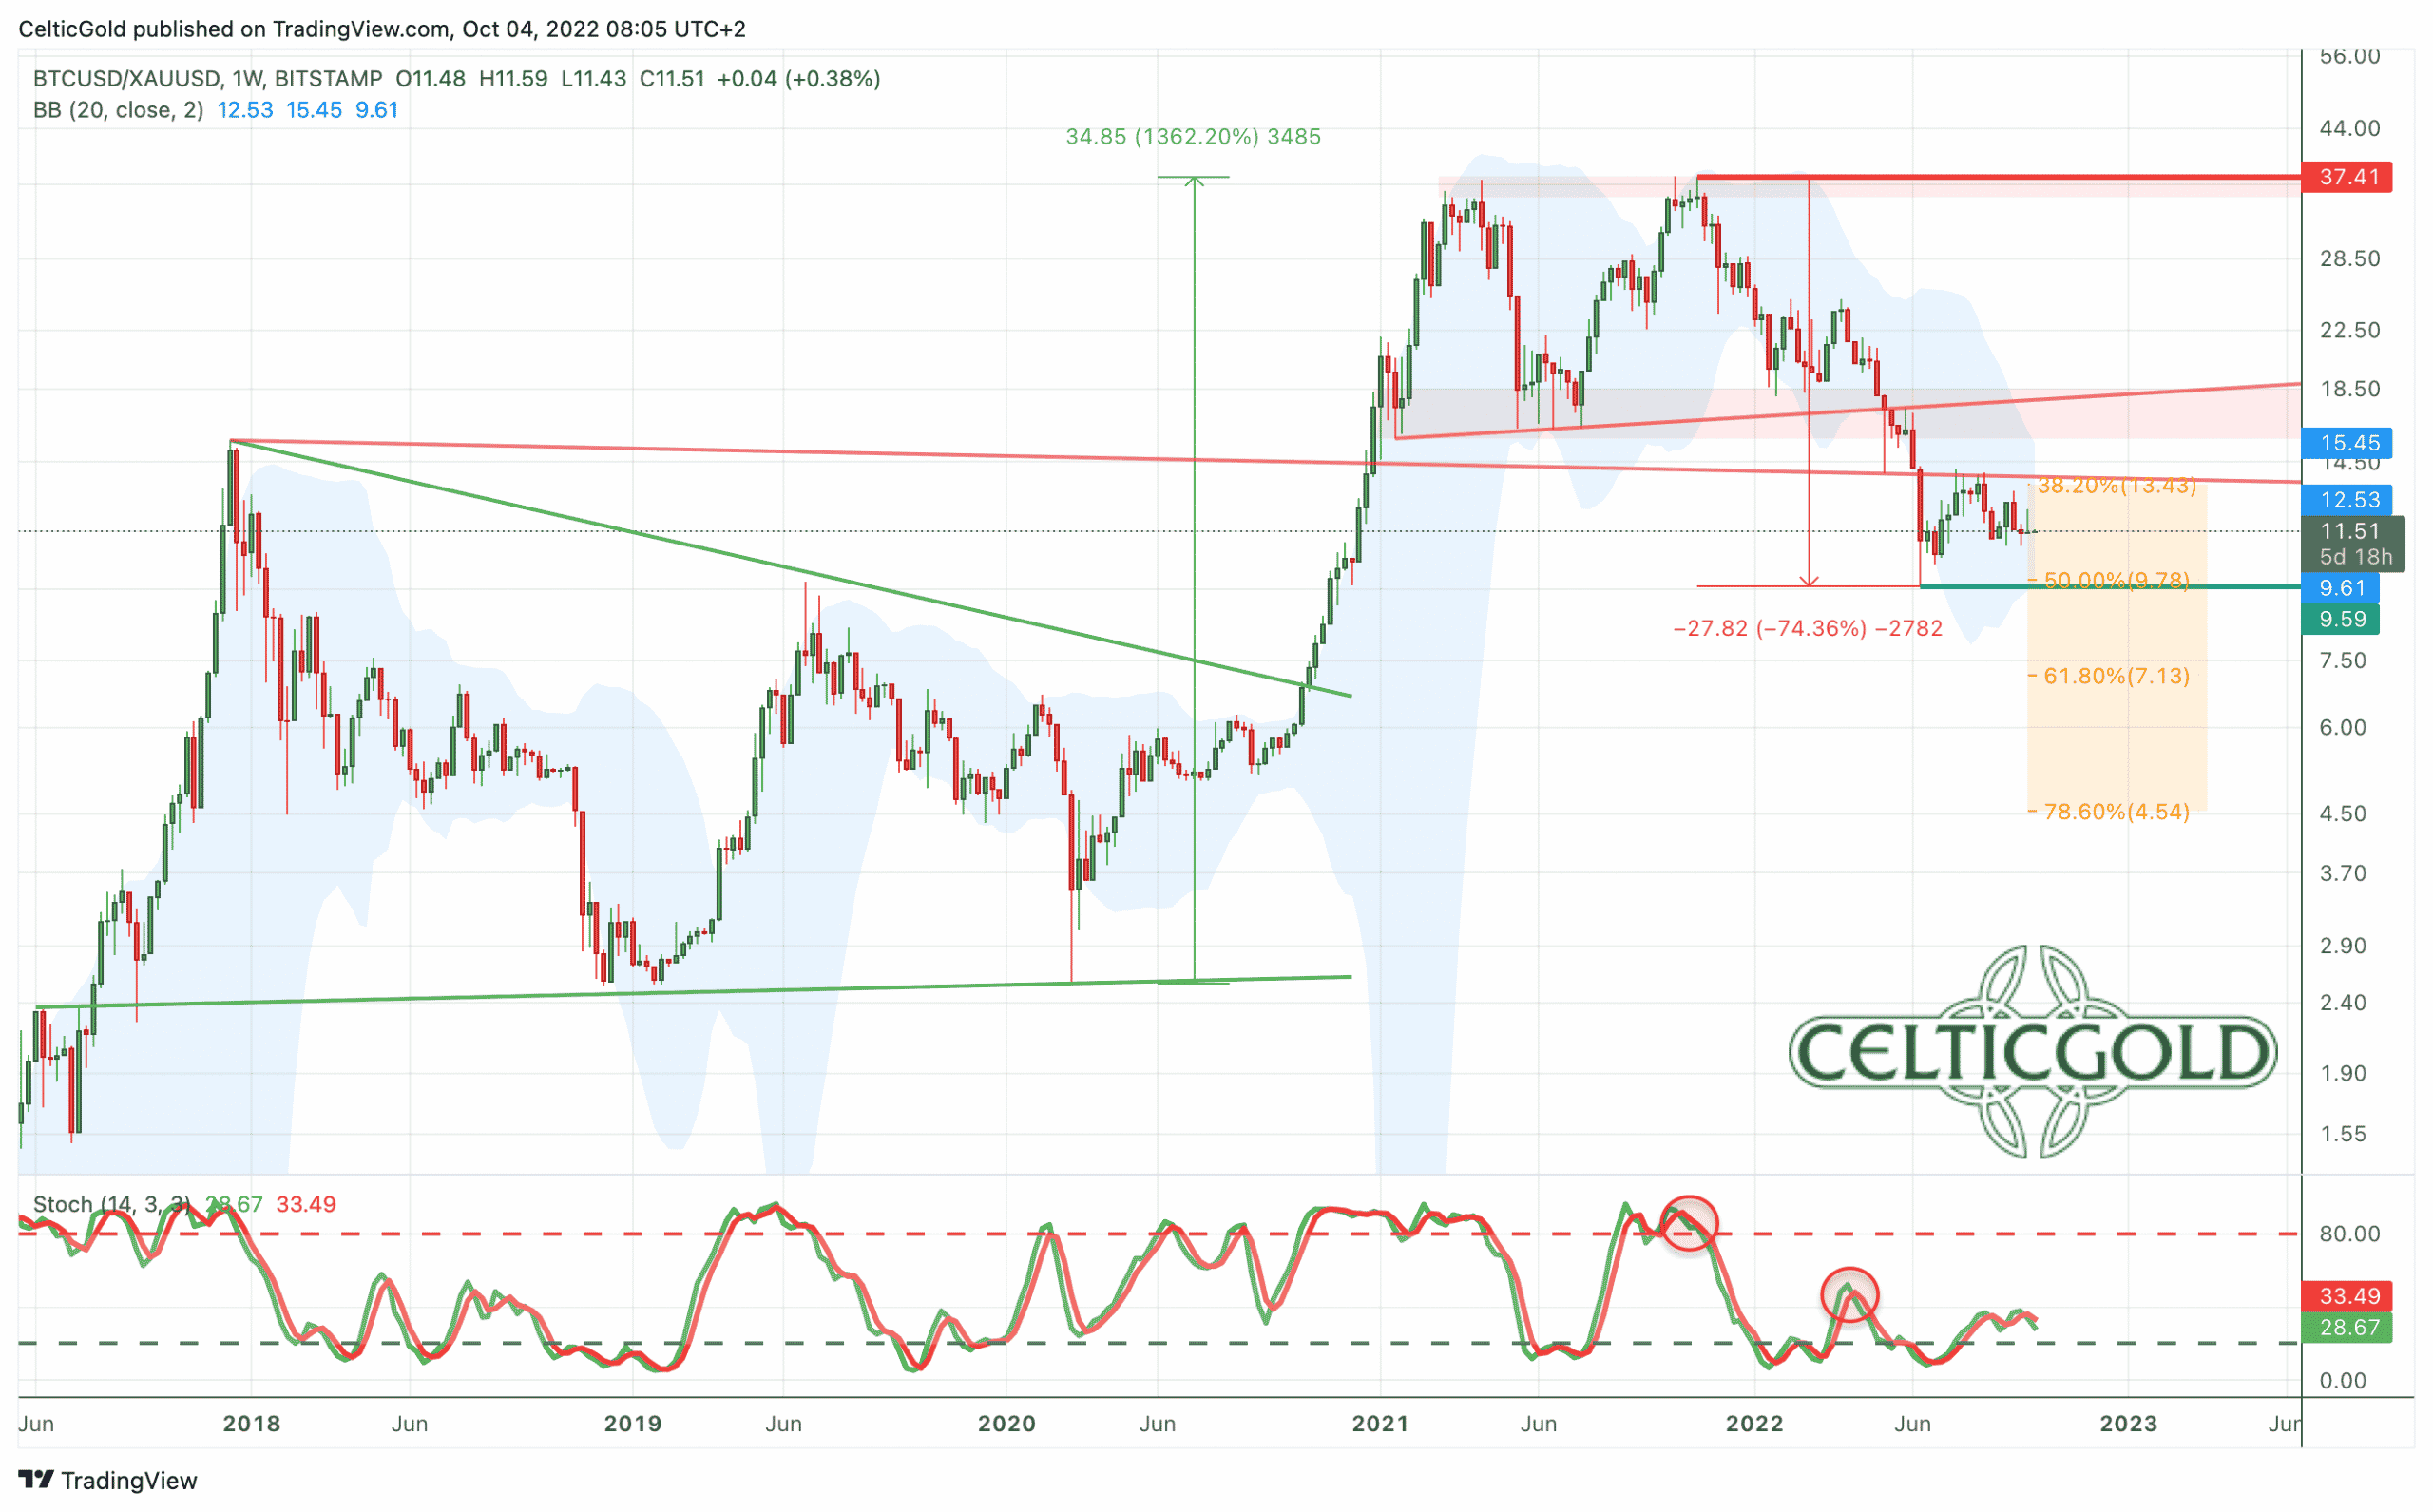
Bitcoin/Gold-Ratio, weekly chart as of October 4th, 2022. Source: Tradingview
At current prices of just around 19,500 USD for one bitcoin and around 1,700 USD for one ounce of gold, you have to pay almost 11.5 ounces of gold for one bitcoin. Put another way, a troy ounce of gold currently costs about 0.087 bitcoin. Thus, the bitcoin/gold-ratio has moved sideways over the past six weeks.
Although there was a temporary rise in favor of bitcoin in midsummer, ultimately the ratio has been consolidating the previous sell-off for three and a half months between 9.5 and 13.5. Given the oversold situation in combination with the active stochastic buy signal on the weekly chart, the chances for a recovery in the coming weeks are not that bad.
However, the overarching trend is still pointing south, and the bitcoin/gold-ratio has so far only worked off the 38.2% and the 50% retracement of the previous wave up. Accordingly, the 61.8% retracement (7.13) would be next. Ratio values below 9.6 would activate this next correction target on the downside. Generally speaking, as long as the markets remain in the grip of the bears, the gold price should hold up better than the price of bitcoin.
Allocation of sound money
Generally, buying and selling Bitcoin against gold only makes sense to the extent that one balances the allocation in those two asset classes! At least 10% up to a maximum of 25% of one’s total assets should be invested in precious metals physically, while in cryptos and especially in bitcoin one should hold at least 1% but max. 5%. If you are very familiar with cryptocurrencies and bitcoin, you can certainly allocate much higher percentages to bitcoin on an individual basis. For the average investor, who is primarily invested in equities and real estate, a maximum of 5% in the still highly speculative and highly volatile bitcoin is a good guideline!
“Overall, you want to own gold and bitcoin, since opposites complement each other. In our dualistic world of Yin and Yang, body and mind, up and down, warm and cold, we are bound by the necessary attraction of opposites. In this sense you can view gold and bitcoin as such a pair of strength. With the physical scarcity of gold and the digital scarcity of bitcoin you have a complementary unit of hard assets that will act as a true safe haven in the 21st century. You want to own both!” – Florian Grummes
In summary, the bitcoin/gold-ratio is in a clear downtrend. A temporary recovery or countertrend more is slowly but surely becoming more probable. Nevertheless, the ratio can also fall another floor lower for the time being. Technically, the ratio is currently moving sideways in a meaningless or consolidating manner.
Macro Update – Liquidity Crisis Intensifying
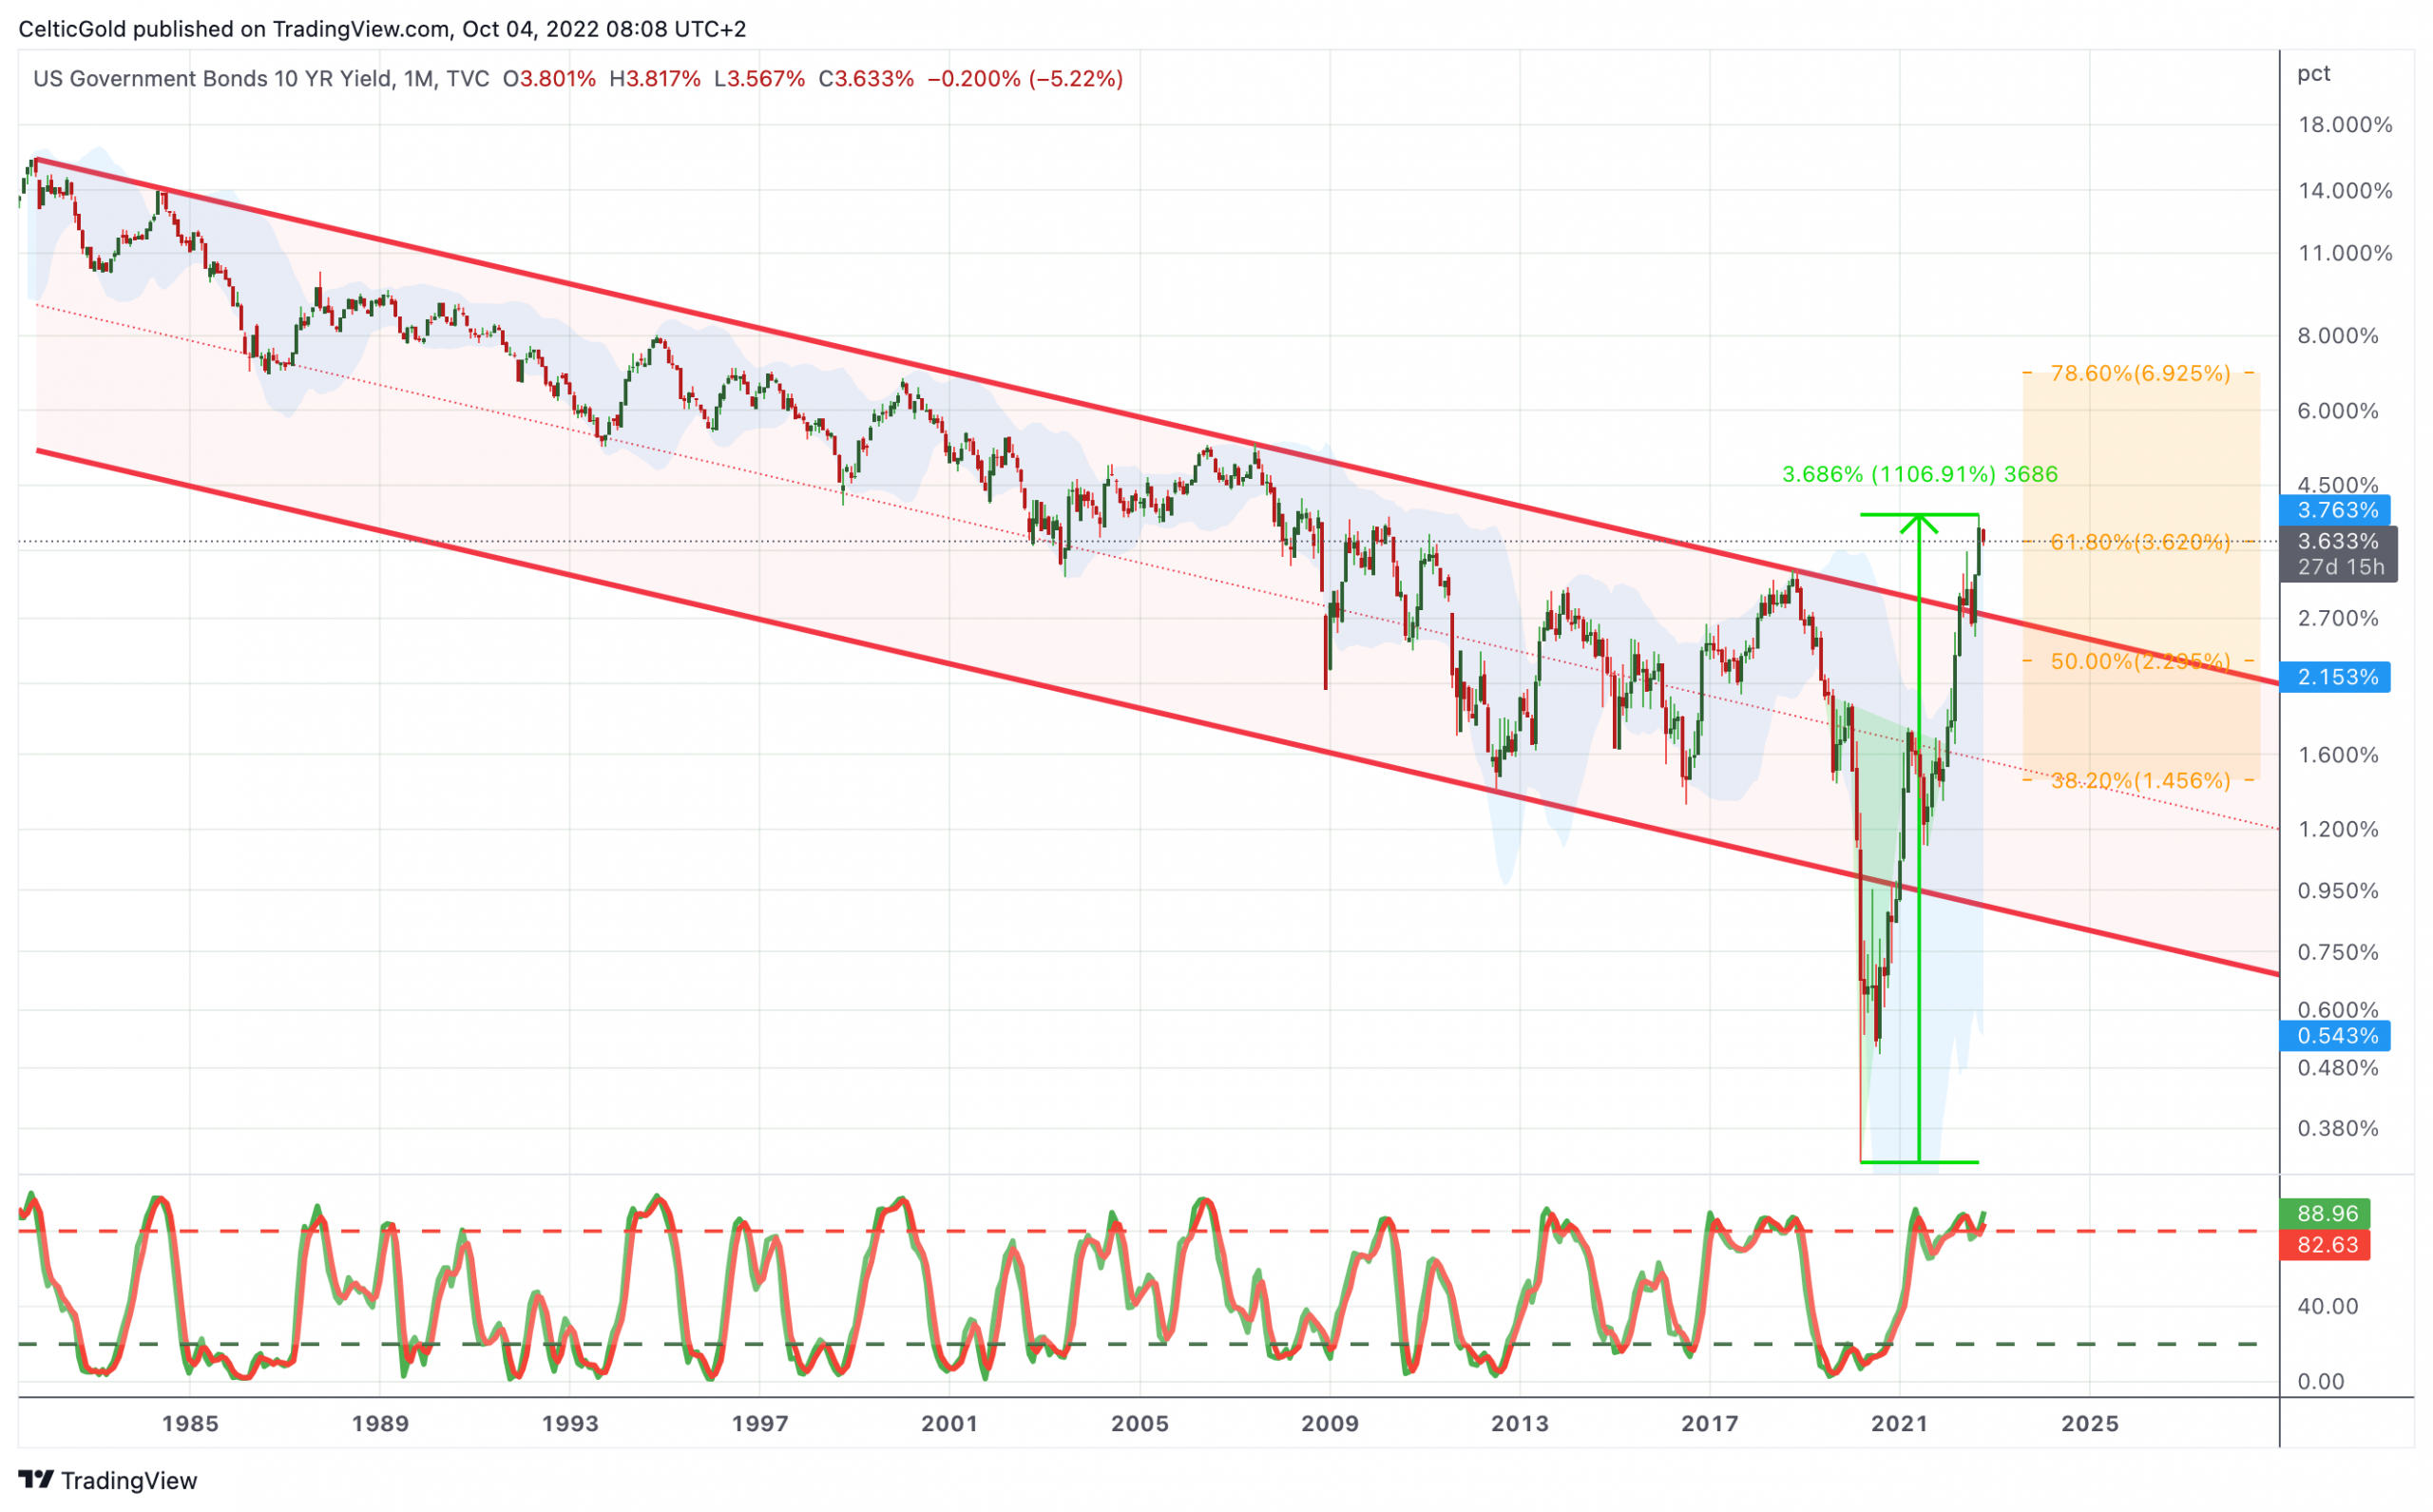
10-year U.S. government bonds, monthly chart as of October 4th, 2022. Source: Tradingview
Stress in the financial markets has been steadily increasing for months. The main driver are the bond markets. Here, the nominal yield on 10-year U.S. government bonds has increased more than tenfold from 0.33% to 3.83% in just two and a half years!
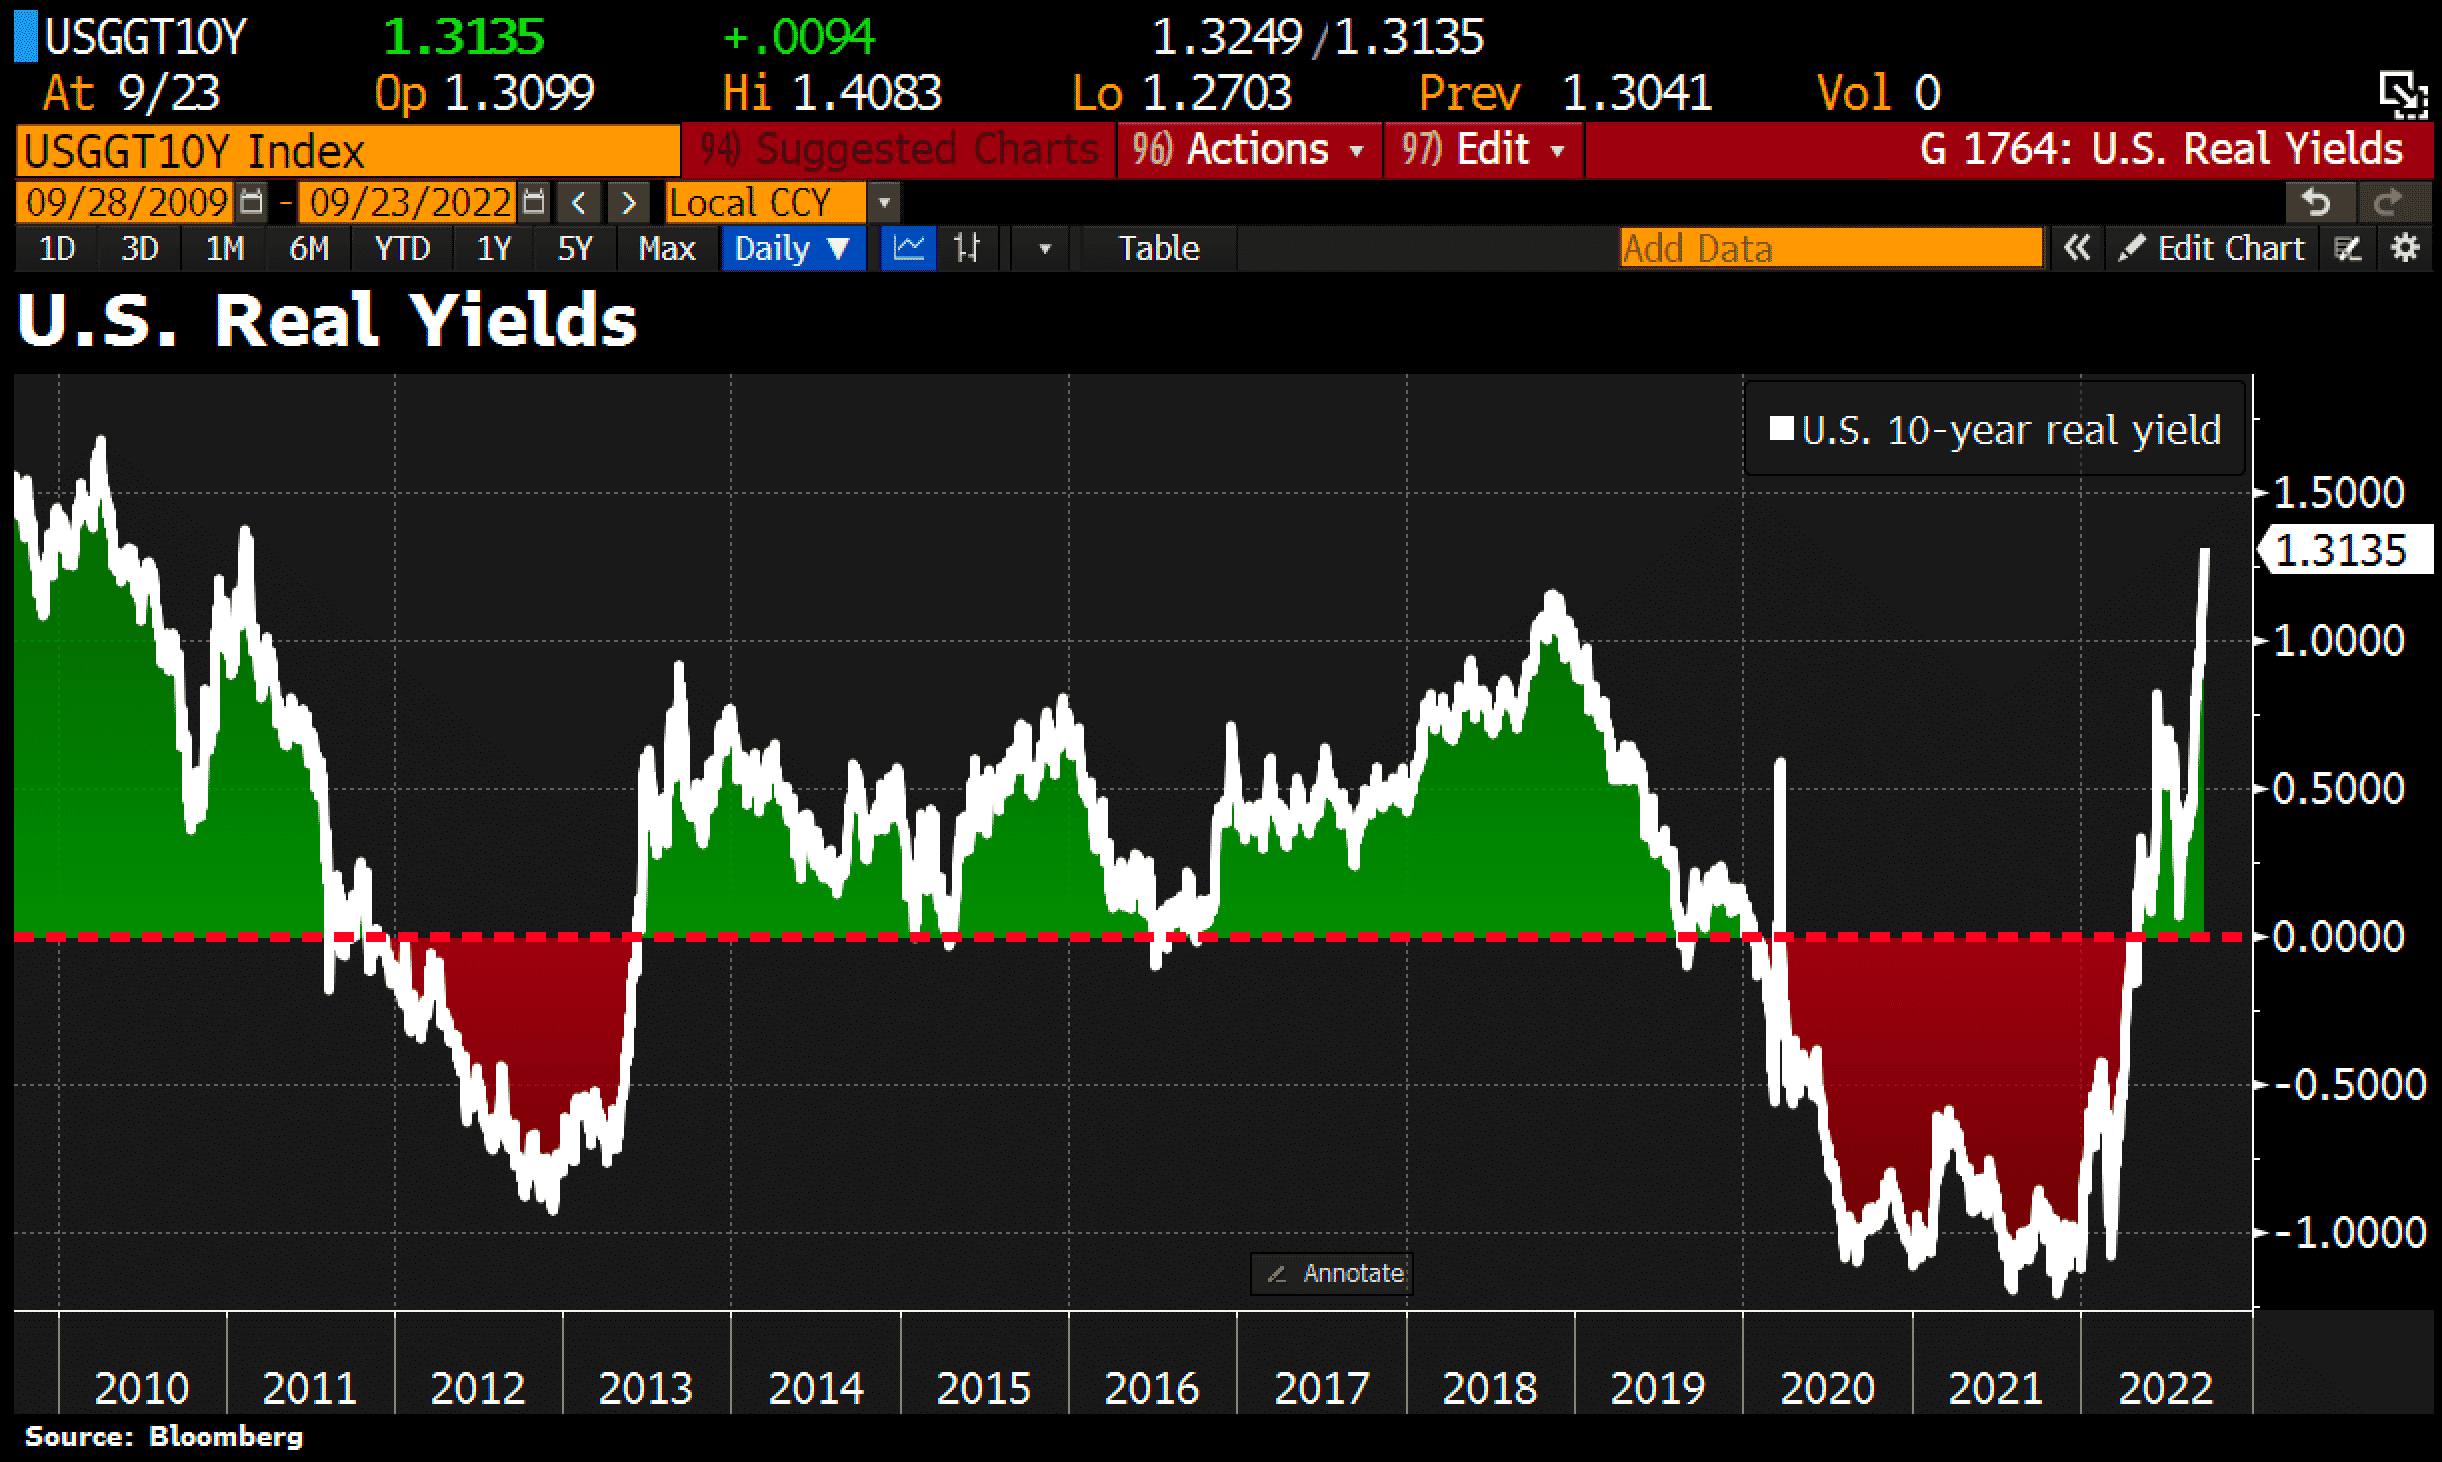
U.S. real interest rates, as of September 25th, 2022. ©Holger Zschaepitz
Consistently, 10-year U.S. real rates have risen to 1.31%, the highest level since 2011.
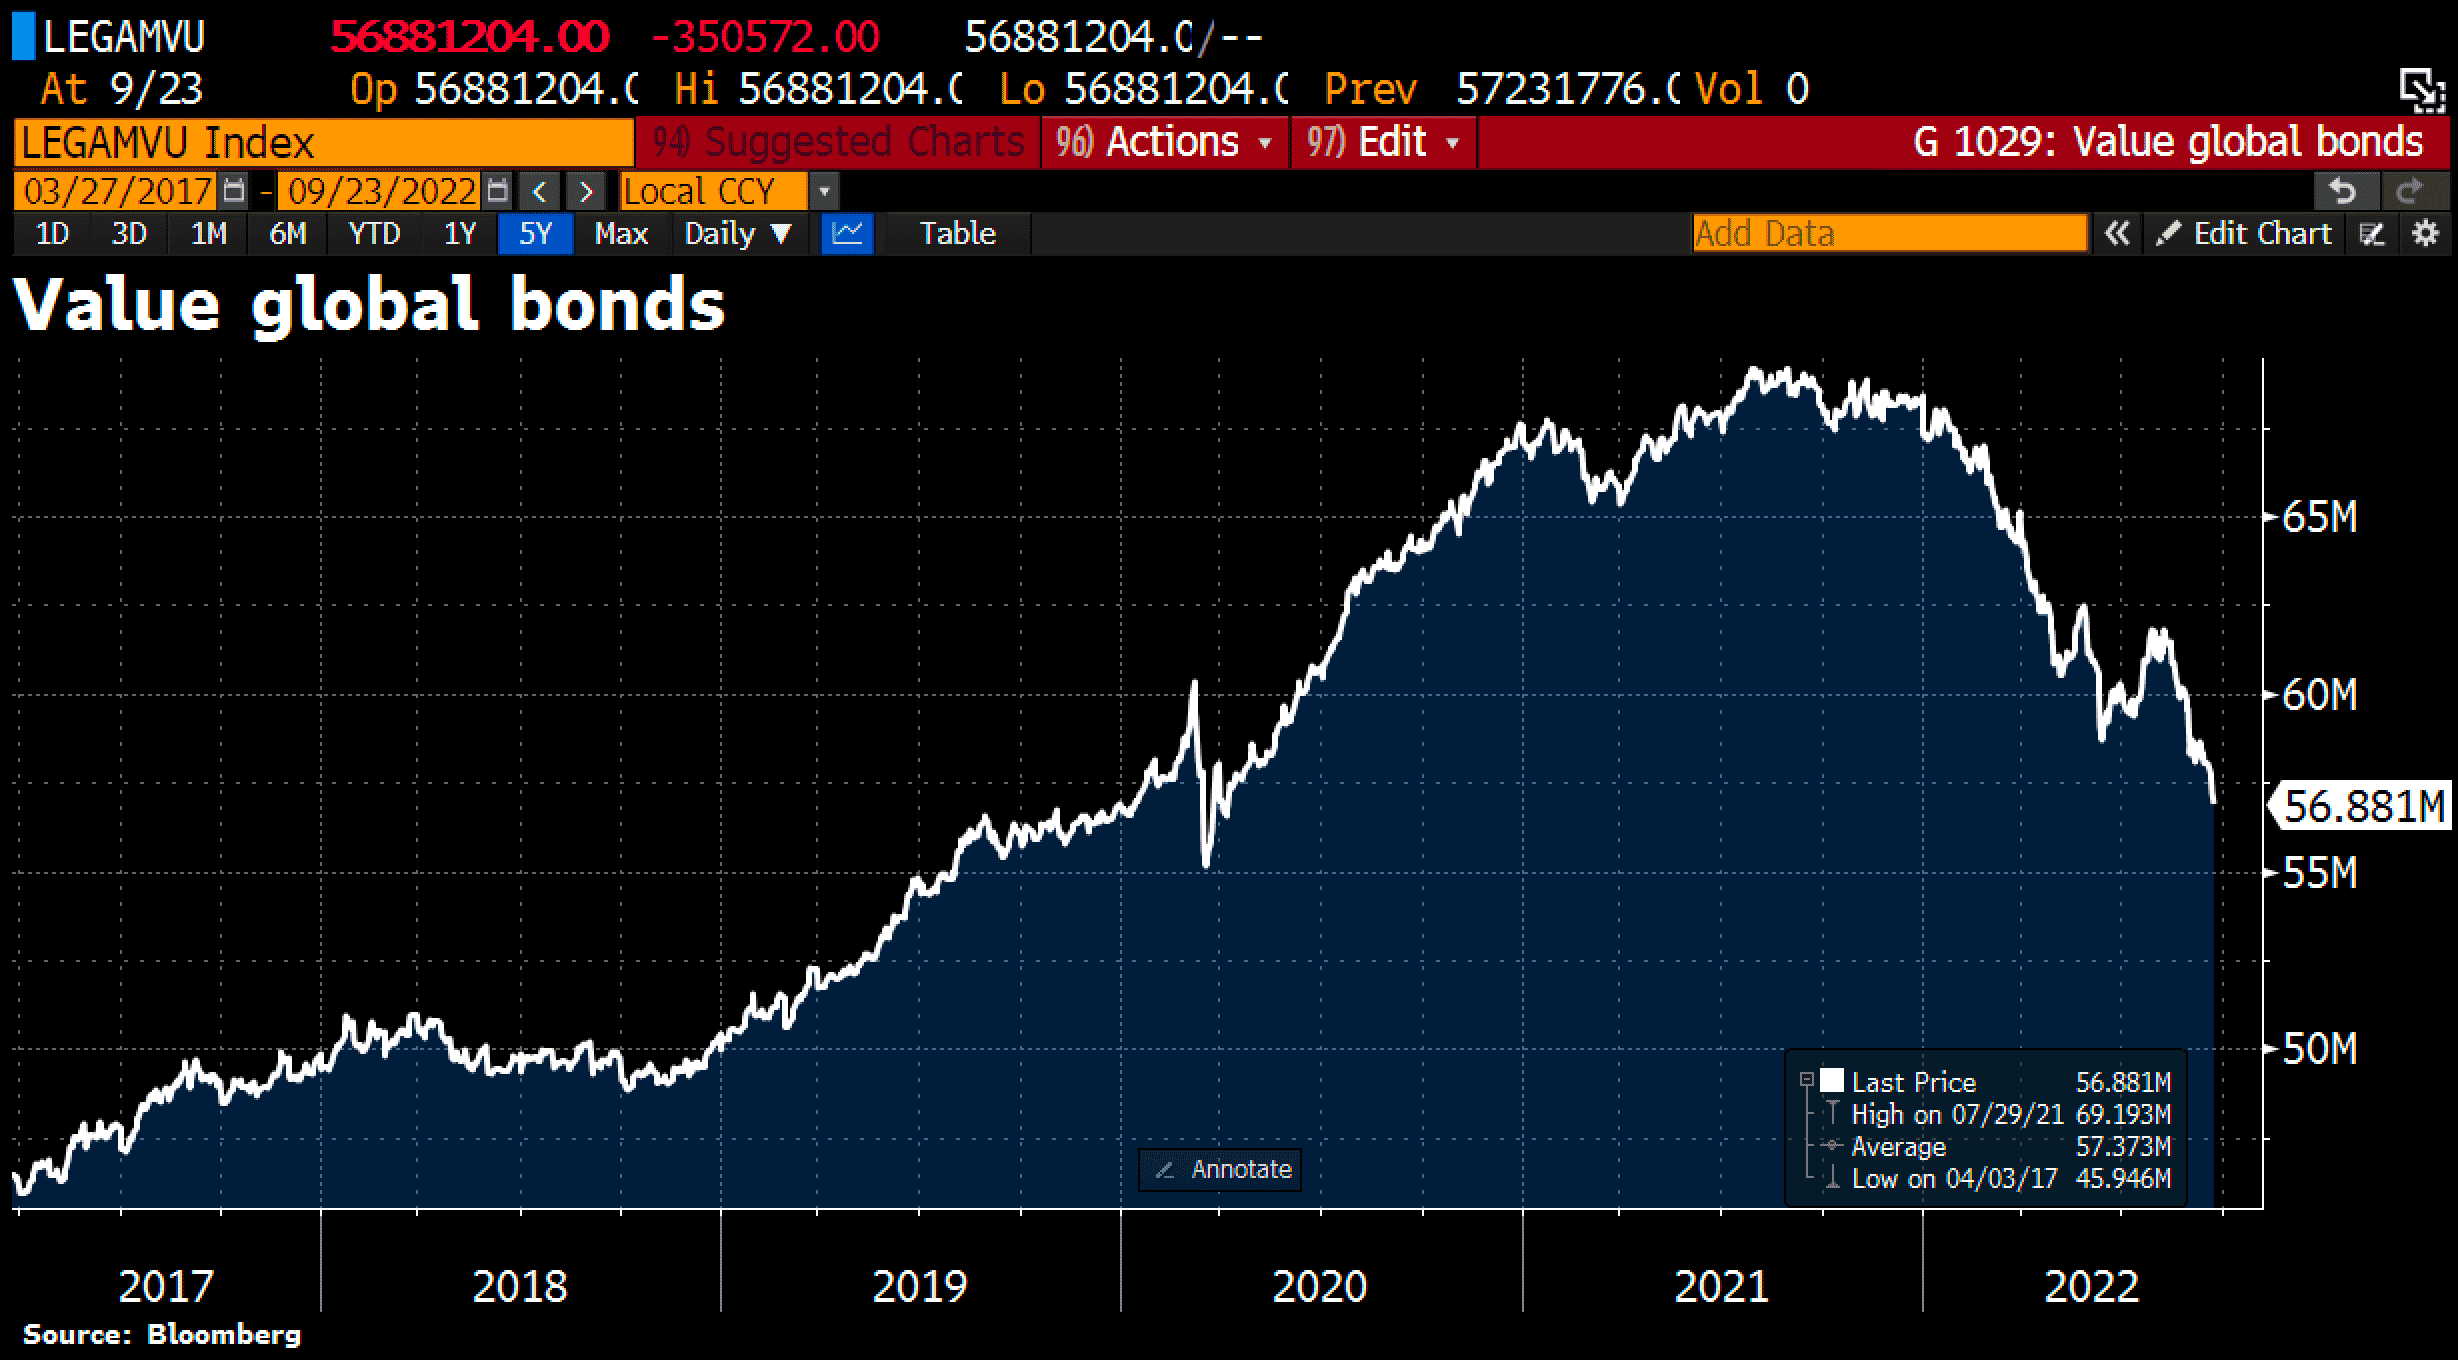
Global bond market, as of September 25th, 2022. ©Holger Zschaepitz
Hence, the forty-year bull market, or bubble, in global bond markets is over! Since the all-time high in mid-2021, the total loss is about 12.2 billion USD! This is increasingly leading to a liquidity squeeze on the U.S. Dollar.

Euro against the U.S. Dollar since 2017, as of September 26th, 2022. ©Holger Zschaepitz
In the very big picture, the U.S. Dollar has been appreciating against almost all other fiat currencies since 2008. Back then, the euro was trading around 1.60 USD against the U.S. Dollar at its peak. Currently, the eurozone currency is trading at just 0.98 USD. A loss of almost 40% in just over 14 years.
The impact of the dollar liquidity crisis on the stock, commodity, real estate and crypto markets has been dramatic. It’s a bear market in everything. And despite the deeply pessimistic sentiment as well as the clearly oversold situation, there are no fundamental or technical trend reversal signals. The final bottom is therefore not in sight. On the contrary, in the last two crises (Internet bubble in 2000 and financial crisis in 2008), central bankers had already ended their rate hiking cycle long before the stock markets peaked.
Biggest political mistakes in its 110-year history?
Now, the non-democratically elected central bankers have just started (ECB) or are continuing (FED) to raise interest rates, while the markets already peaked nearly 11 months ago. Hence, as central bankers continue to raise rates in the midst of a bear market for the first time in history, markets are likely to fall much lower than most can imagine. The high inflation caused by scarcity (lockdown) and a 50-year orgy of money printing (end of the gold standard in 1971) is now to be brought under control with a sledgehammer. The danger that something will go wrong (real economy) is very high and we have to assume that the Fed is currently making one of the biggest political mistakes in its 110-year history, which could lead to a severe recession or even a depression lasting for years.
At the same time, consumers are being squeezed completely as mortgage rates have risen to their highest levels since 2008, while inflation is clearly outpacing wage growth, savings rates have reached historic lows, labor markets are getting worse, and overall consumer sentiment is more than depressed.
In a best-case scenario, markets can stabilize from mid- to late October and then start a year-end rally in November or December. In this process, everything should then rise, while the overbought U.S. Dollar would correct. Nevertheless, significant liquidity in U.S. Dollars and Swiss Francs remains the order of the day, because as long as central banks do not change course, cash = king. Sectors with low trading volume (such as small-caps, altcoins, junior & exploration mining stocks) are rather to be avoided. Physical precious metals, however, should be accumulated gradually. Bitcoin will also benefit from a recovery starting in mid or late October. However, the crypto winter is not over and might return in 2023.
Conclusion: Bitcoin – In The Midst Of An Epic Liquidity Crisis
If, as is currently the case, U.S. Dollar liquidity dries up, so will markets, economies, and lifestyles. After all, all market crises are basically just liquidity crises. Hoping that the markets would be on the verge of a V-shaped trend reversal in this context seems not only naïve, but negligent. Of course, anything is always possible, but even if central bankers were to turn things around tomorrow, it usually takes months for such a trend reversal to manifest itself sustainably in the markets.
Until now, however, the U.S. Dollar is not yet confirming a reversal. As long as the greenback remains strong and trending higher, the liquidity crisis will continue and all asset classes will remain under pressure. For bitcoin, the support in the area around 18,000 USD is at stake. Should the bears be able to prevail, prices will likely correct further towards 14,000 USD and 10,000 USD. Our worst case scenario remains 6,000 USD in the medium term. However, we suspect that there will be a sharp recovery rally in all markets. It might have started already or will start somewhere between mid and end of October. This will postpone the final sell-off until next year.
Analysis sponsored and initially published on September 29th, 2022, by www.celticgold.eu. Translated into English and partially updated on October 4th, 2022.
Feel free to join us in our free Telegram channel for daily real time data and a great community. If you like to get regular updates on our gold model, precious metals, commodities, and cryptocurrencies you can also subscribe to our free newsletter.
Disclosure:
This article and the content are for informational purposes only and do not contain investment advice or recommendations. Every investment and trading move involves risk, and readers should conduct their own research when making a decision. The views, thoughts and opinions expressed here are the author’s alone. They do not necessarily reflect or represent the views and opinions of Midas Touch Consulting.

