Silver – Next Attack on the Resistance
Since the beginning of the year gold has lost almost US$300 from the high at US$1,959 to the low last Monday at US$1,676. Silver however has held up a bit better reaching a low at US$24.83. Nevertheless, all market participants who had hoped for a silver squeeze have been significantly disappointed in recent weeks. With the gold/silver-ratio currently sitting at around 66 this ratio shifted further in favor of silver. Surprisingly, this trend remained in place since gold marked its new all-time high on August 7th, 2020, despite the seven-month correction in the precious metals sector. And a trend change in the gold/silver-ratio is not apparent. Hence, silver likely will continue to outperform gold in the coming quarters. Silver – Next Attack on the Resistance
In the short term, however, the gold bulls achieved a promising first bounce reaching US$1,740 (=+3.5% from the low on Monday). With the weekly close at US$1.726 the psychological level of US$1.700 did hold on Friday. The price of silver increased by 6.6% in the same period. The chances for a large turning point in the precious metals sector have thus increased significantly. Silver and especially gold are clearly oversold after the long and difficult seven months correction. Despite a rather challenging seasonal environment both metals should now be able to post a significant recovery over the coming weeks and months, at least. Around June or July the start of a sustainable uptrend towards US$2,000 and higher for gold, as well as the break above the US$30.00 resistance for silver, would then be expected.
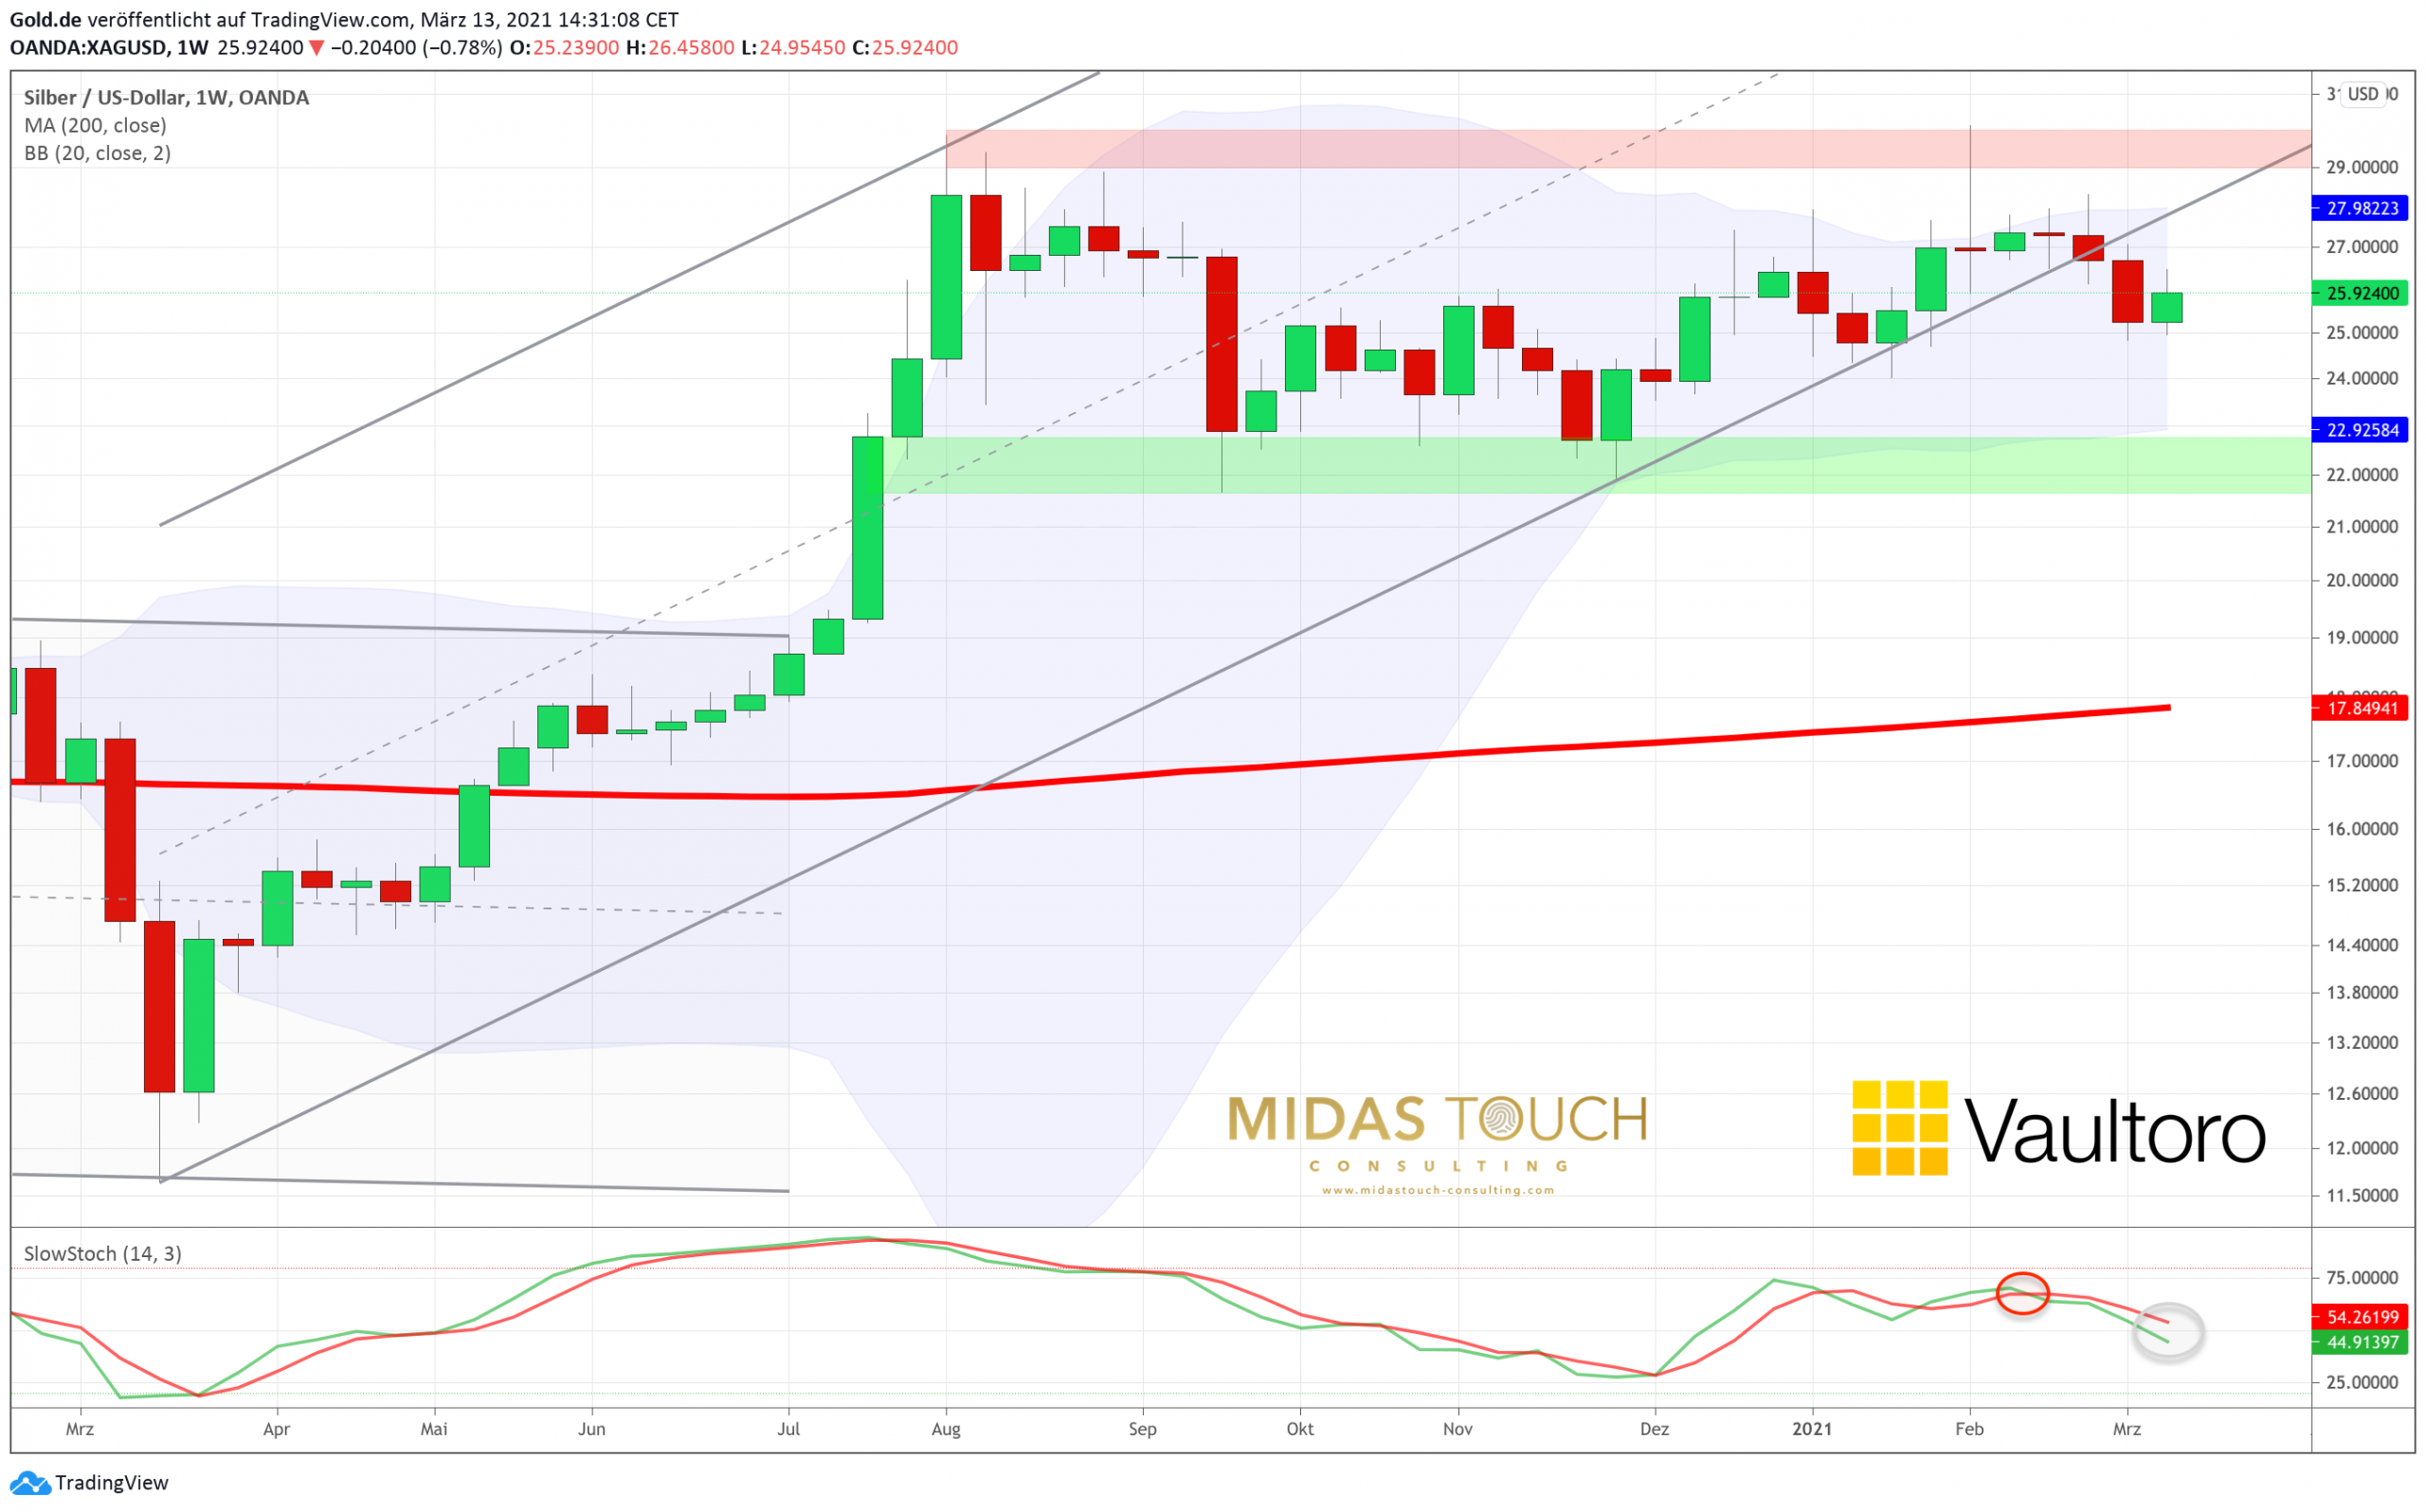
Weekly Silver Chart in USD – Sideways between US$23 and US$28
On the weekly chart, the upper Bollinger Band (US$28.02) actually prevented the silver price from breaking out four weeks ago. Now the silver bulls have to gather their strength again. Trading pretty much in the middle of the Bollinger bands it will take some work to bend the upper band further towards US$30. With the neutral stochastic oscillator this is possible, but the constellation is not really ideal. In the case of gold, however, the weekly stochastic oscillator is extremely oversold, so a sharp and far-reaching recovery is much more likely here. Gold will therefore probably have to march ahead in the coming weeks until the summer and silver will simply follow!
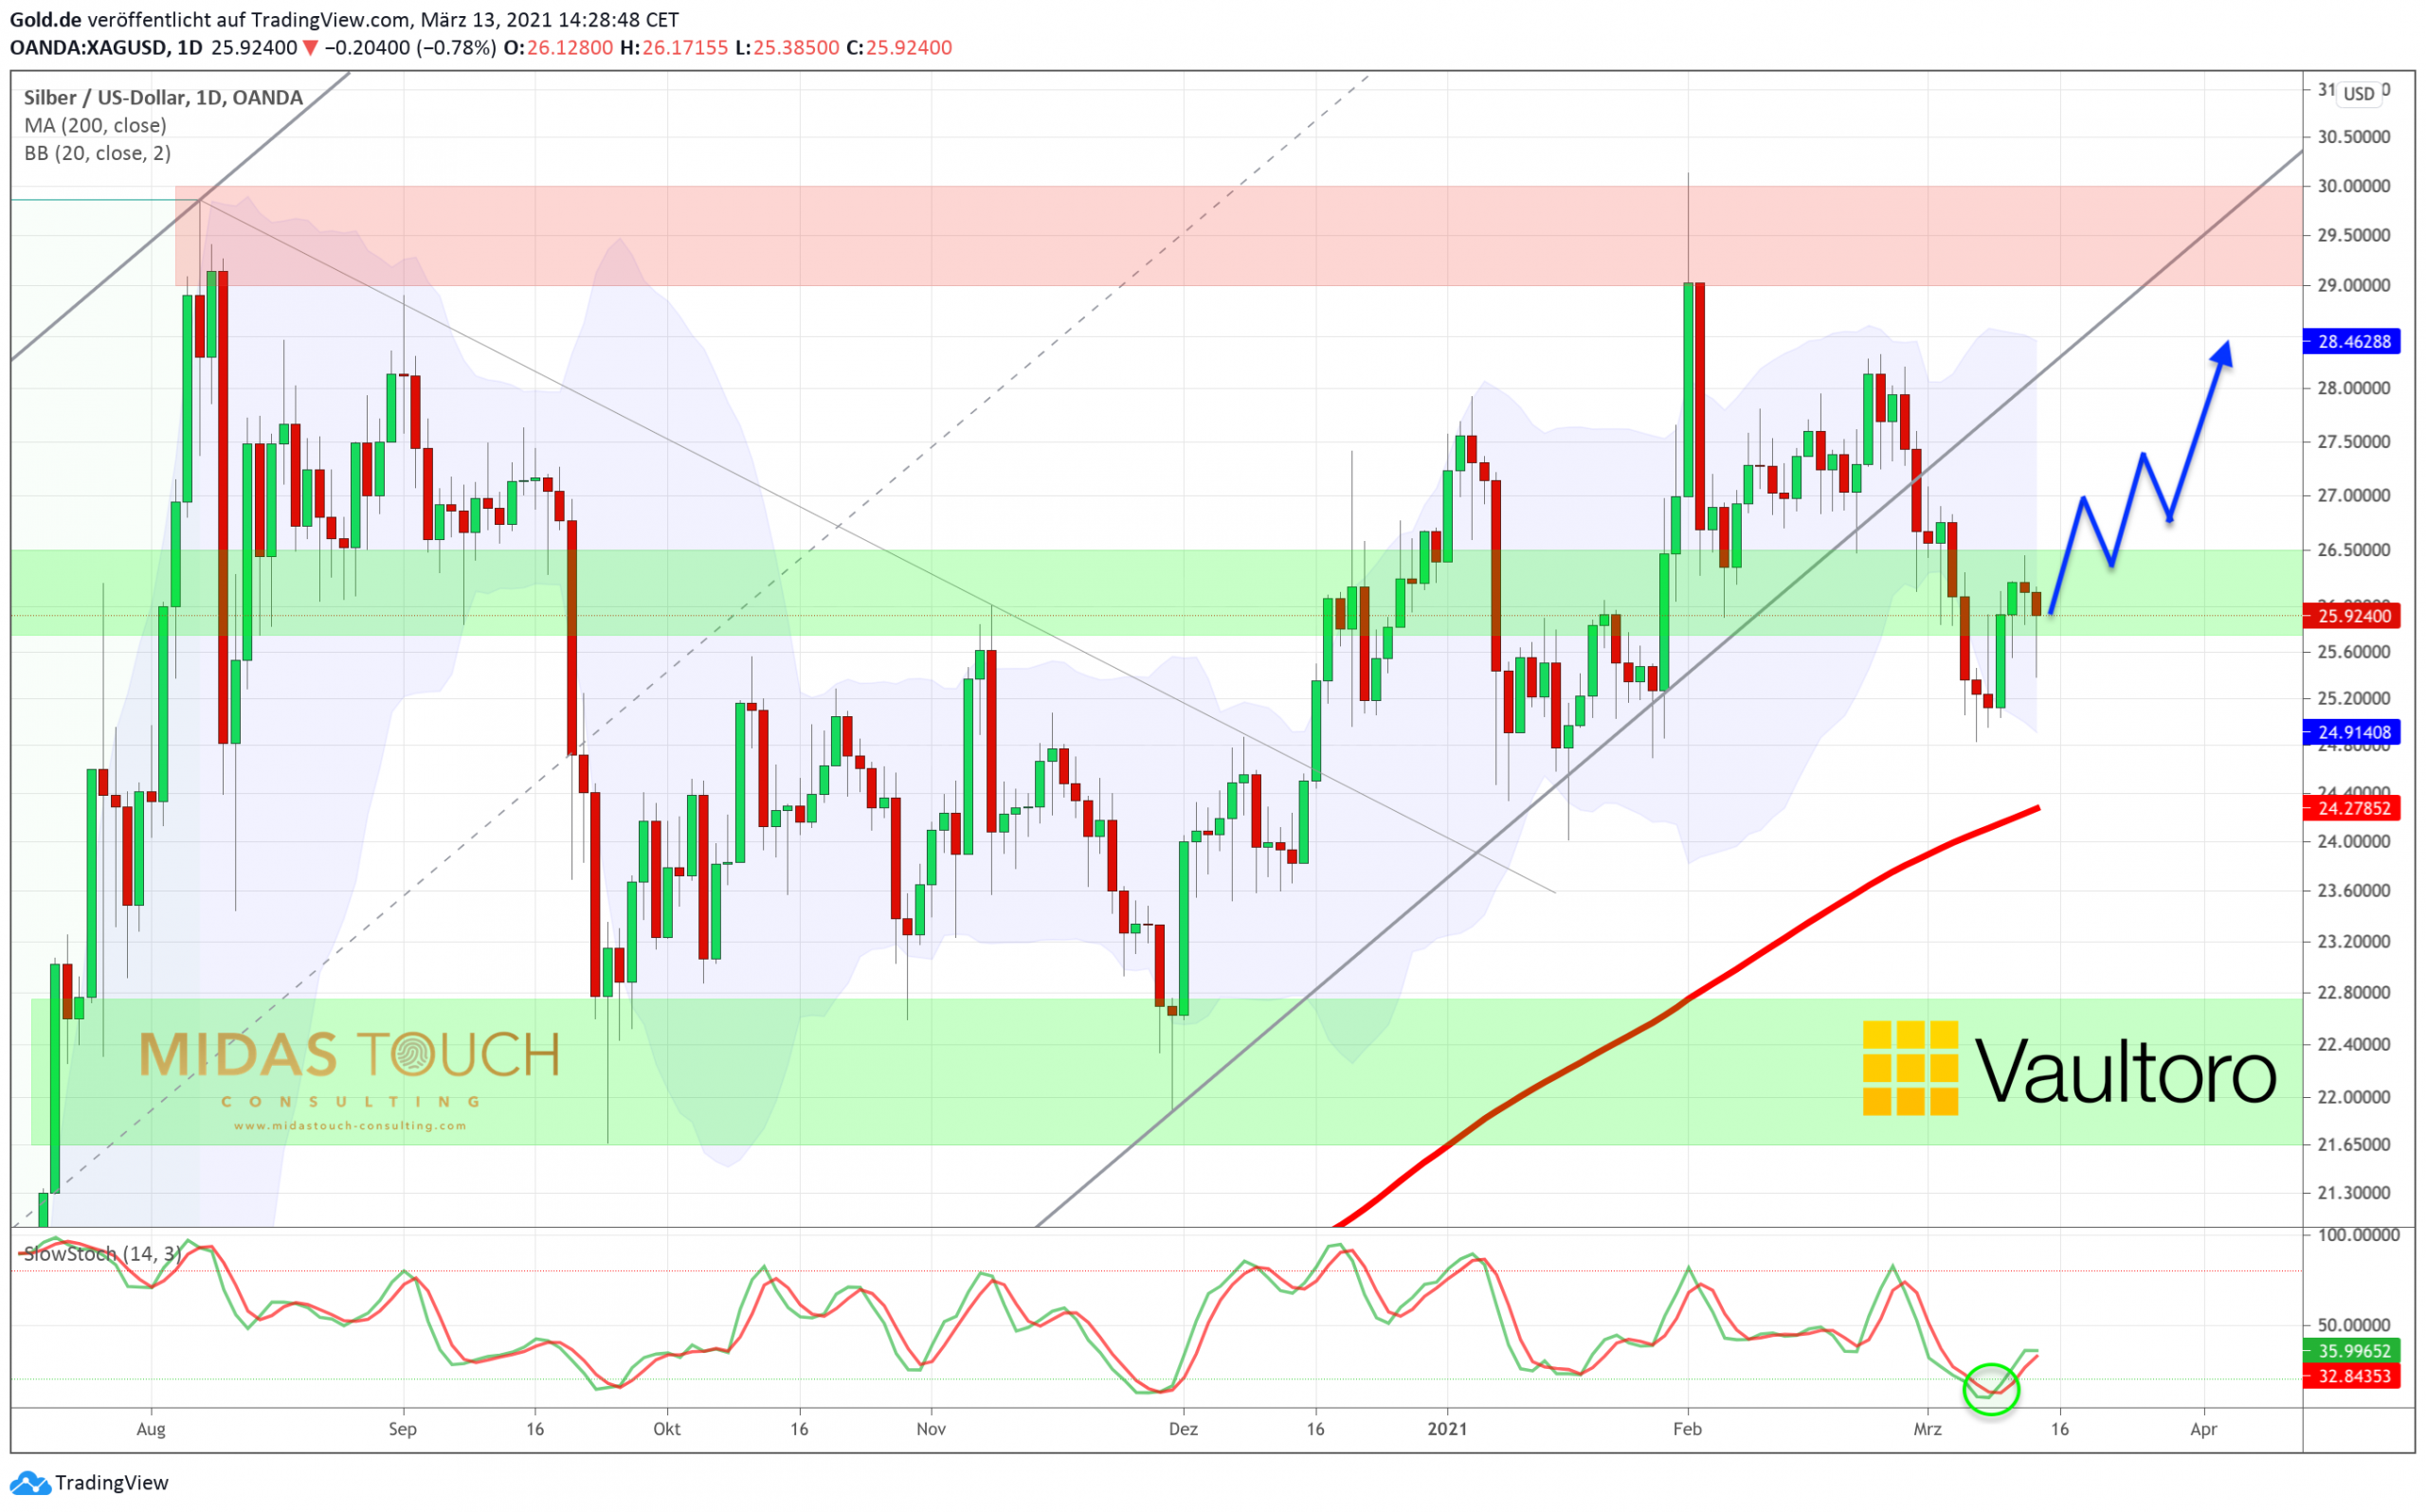
Daily Silver Chart in USD – Recovery towards US$28
The situation on the daily silver chart looks better. Here, the stochastic oscillator has clearly turned upwards from the oversold zone since Monday, shifting the momentum towards bullish. Silver is now facing only minor resistance on the way to around US$28. Interestingly, the silver bears have once again missed the rising 200-day moving average (US$ 24.23). On the one hand, this indicates an enormous strength, on the other hand it’s rather unlikely that silver can start a strong new wave up without a previous test of this important moving average. In this respect, the reunion has probably simply been postponed again by a few weeks or months and should then take place at higher levels in early summer.
Overall, the set up for silver remains bullish. The pullback was and is a buying opportunity. The series of higher lows is intact and silver will likely attack the resistance zone around US$30 several times over the coming months. Latest in the second half of this year silver should be able to break out above US$30, unleashing the rally towards US$50.
Silver in EUR: Purchase limit remains at 21.50 EUR
Between March 3rd and March 9th our purchase limit of 21.50 EUR was filled several times without any problems. Even though prices quickly recovered to 22 EUR, there is still no reason to increase the buy limit.
Feel free to join us in our free Telegram channel for daily real time data and a great community.
If you like to get regular updates on our gold model, precious metals and cryptocurrencies you can subscribe to our free newsletter.


