


Rally still has room
After a difficult and mostly corrective year, gold found an important low in mid-December 2021 at US$1,753. Since then, prices have been able to take advantage of the oversold setup and the beaten down sentiment. The current favorable seasonal pattern is helping, too. Hence, since December 15th gold has rallied around US$90 (+5.2%), reaching a two-month high at US$1,843. Especially Wednesday the 19th, 2022, was a strong day and gold broke through the well-known resistance zone around US$1,830 with ease. Rally still has room.
Gold in US-Dollar, weekly chart from January 20th, 2022. Caught in a sideways consolidation.
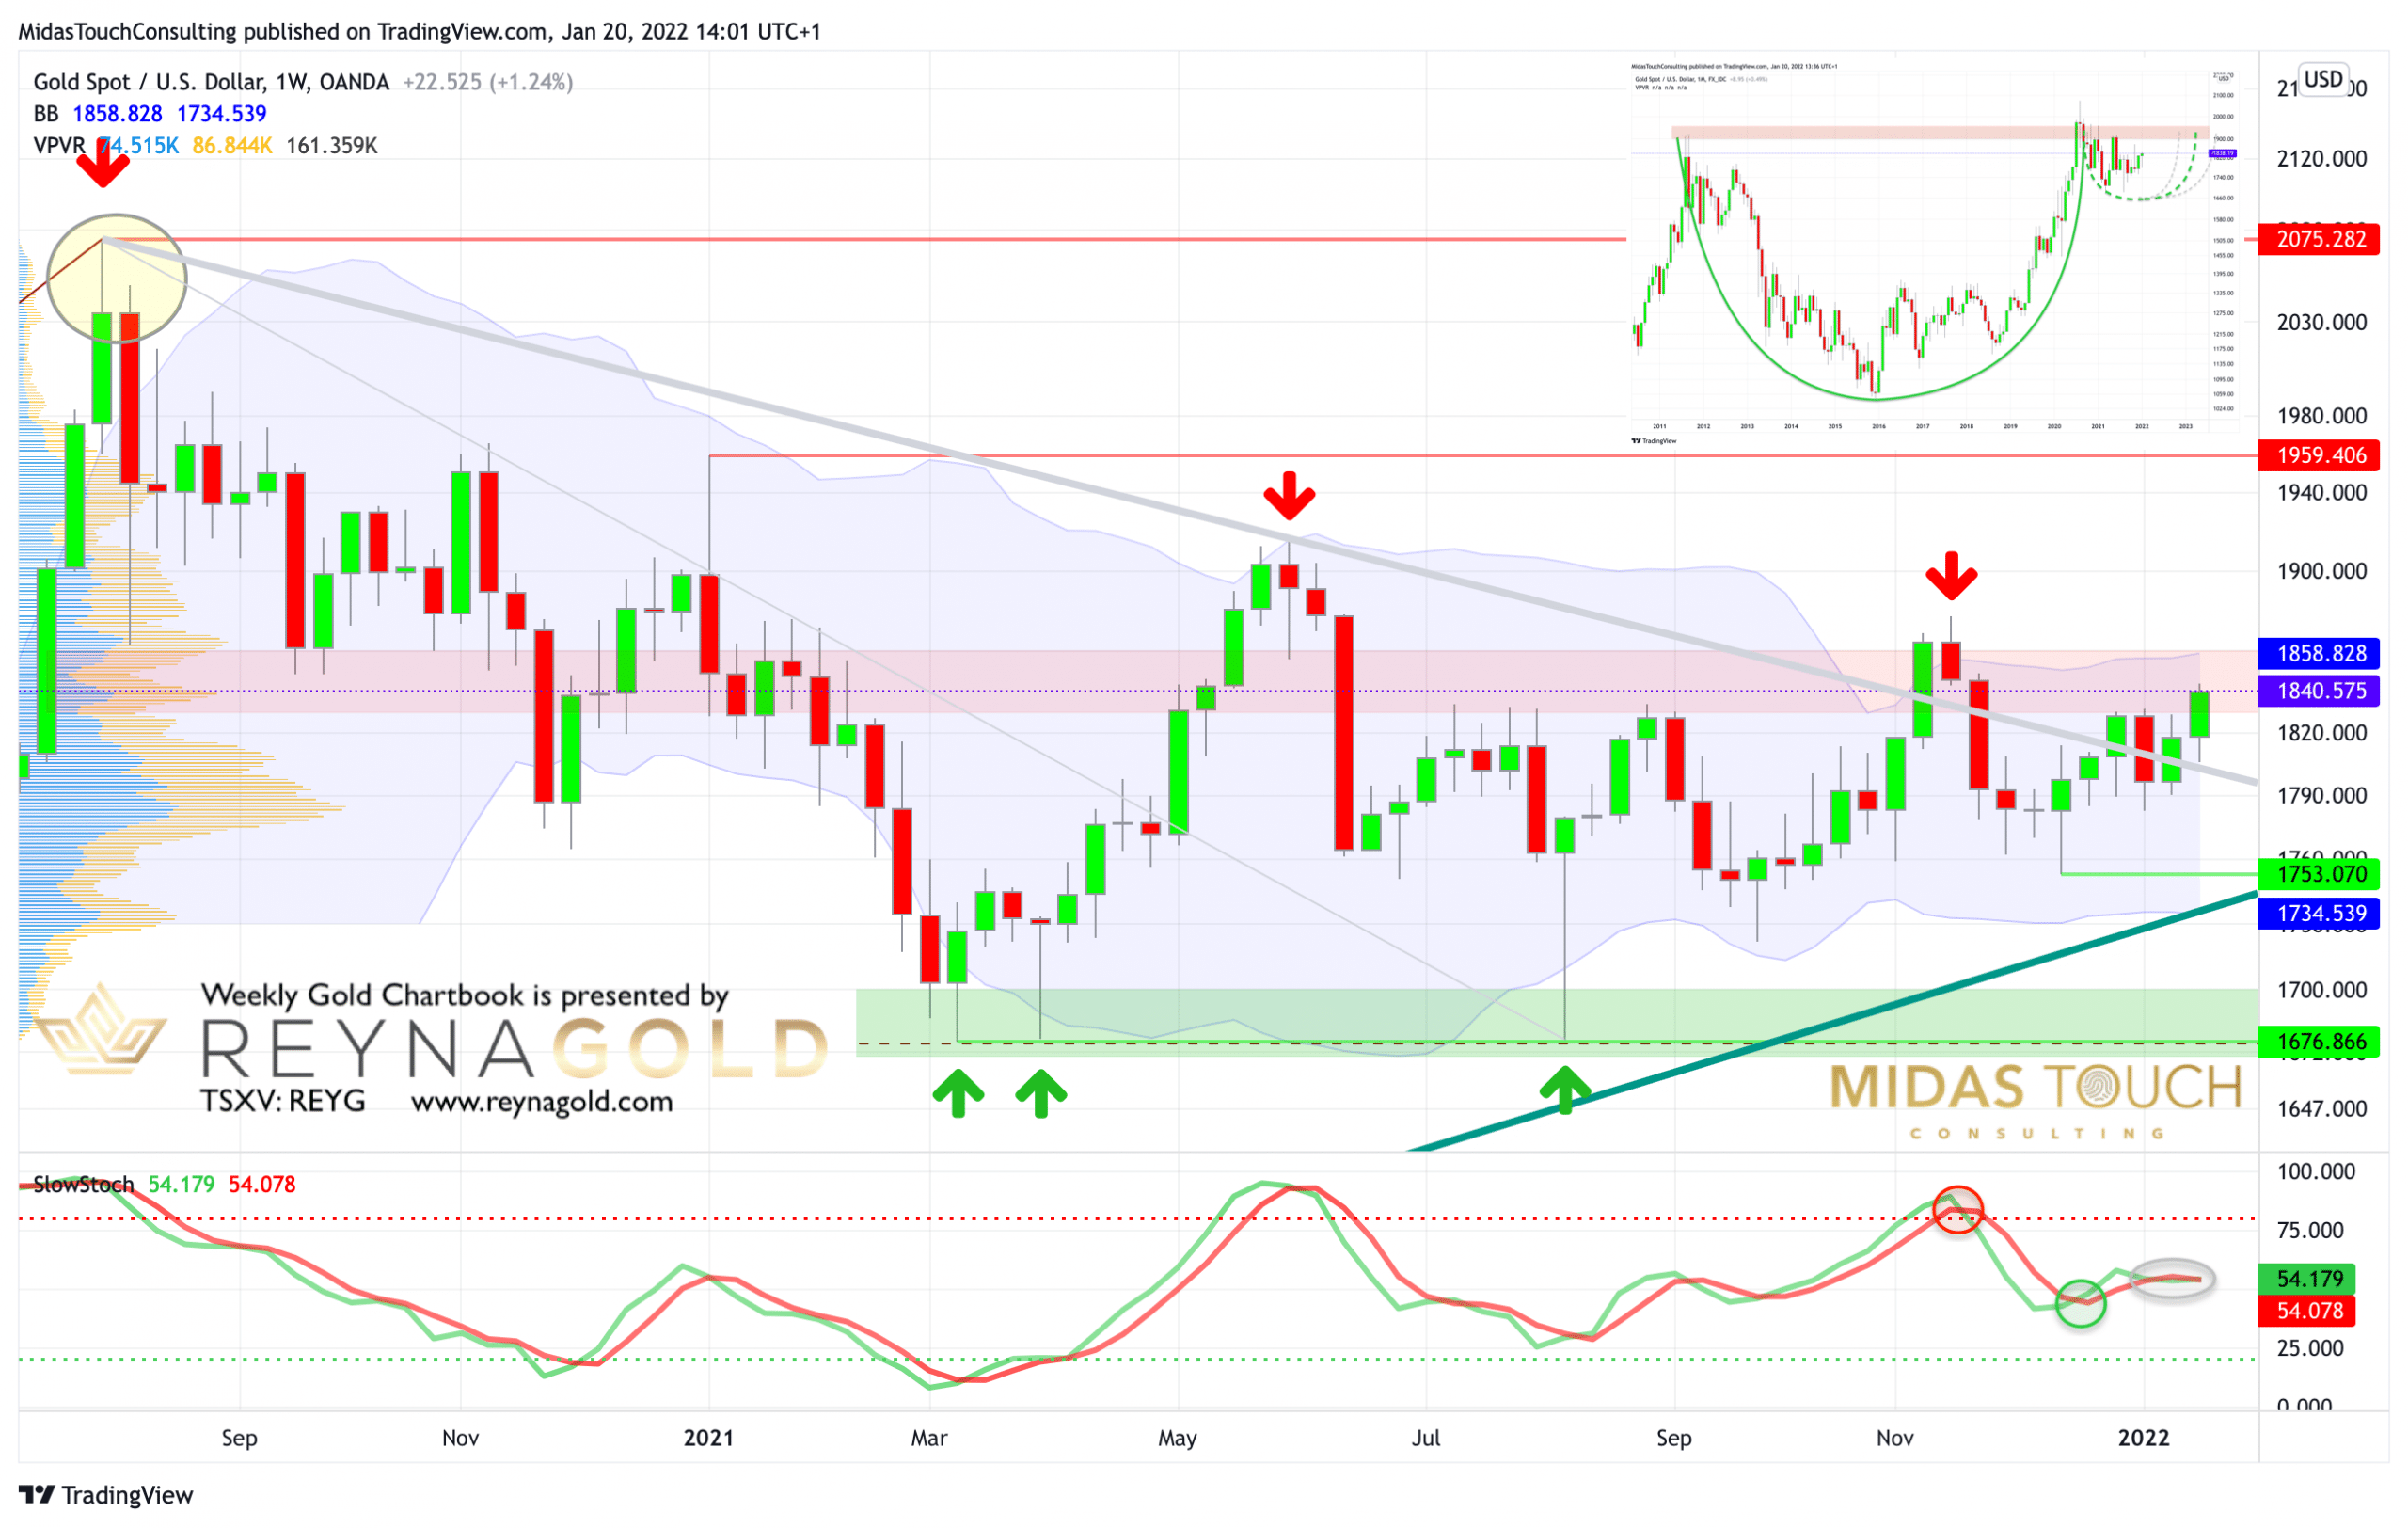
Gold in US-Dollar, weekly chart as of January 20th, 2022.
On the weekly chart, gold is still caught in this tenacious and irritating sideways correction. In the even bigger picture, however, this sideways phase is likely the cup of a huge cup & handle set-up, which is building in the gold-market since the top in 2011. Accordingly, once gold breaks above the pattern’s trend line sitting at around US$1,950 to US$1,965, a massive bull run towards the mid US$2,000s and higher is very likely to follow.
However, even though this huge cup & handle pattern is a bullish continuation pattern, gold is not yet there! According to the 8-year cycle in gold, it could still take another two years before a final low within the ongoing correction is being reached. Comparing the length of the cup with the length of the current handle rather suggests that gold might need more time. On the other hand, the macro setup in our world is more unstable than ever and no one can afford to not own gold and silver in these challenging times, when producer price inflation just hit 22% in Germany!
Overall, the weekly chart for gold currently is neutral. The rising upper Bollinger band (US$1,858) would still offer some room for the ongoing rally to unfold. In fact, the resistance zone between US$1,860 and US$1,875 is a realistic target until the end of February. Whether the bulls will be able to push gold by another one or two levels higher remains to be seen. For the sake of completeness, the next price targets would then be at US$1,910 and US$1,950.
Gold in US-Dollar, daily chart from January 20th, 2022. Rally still has room.
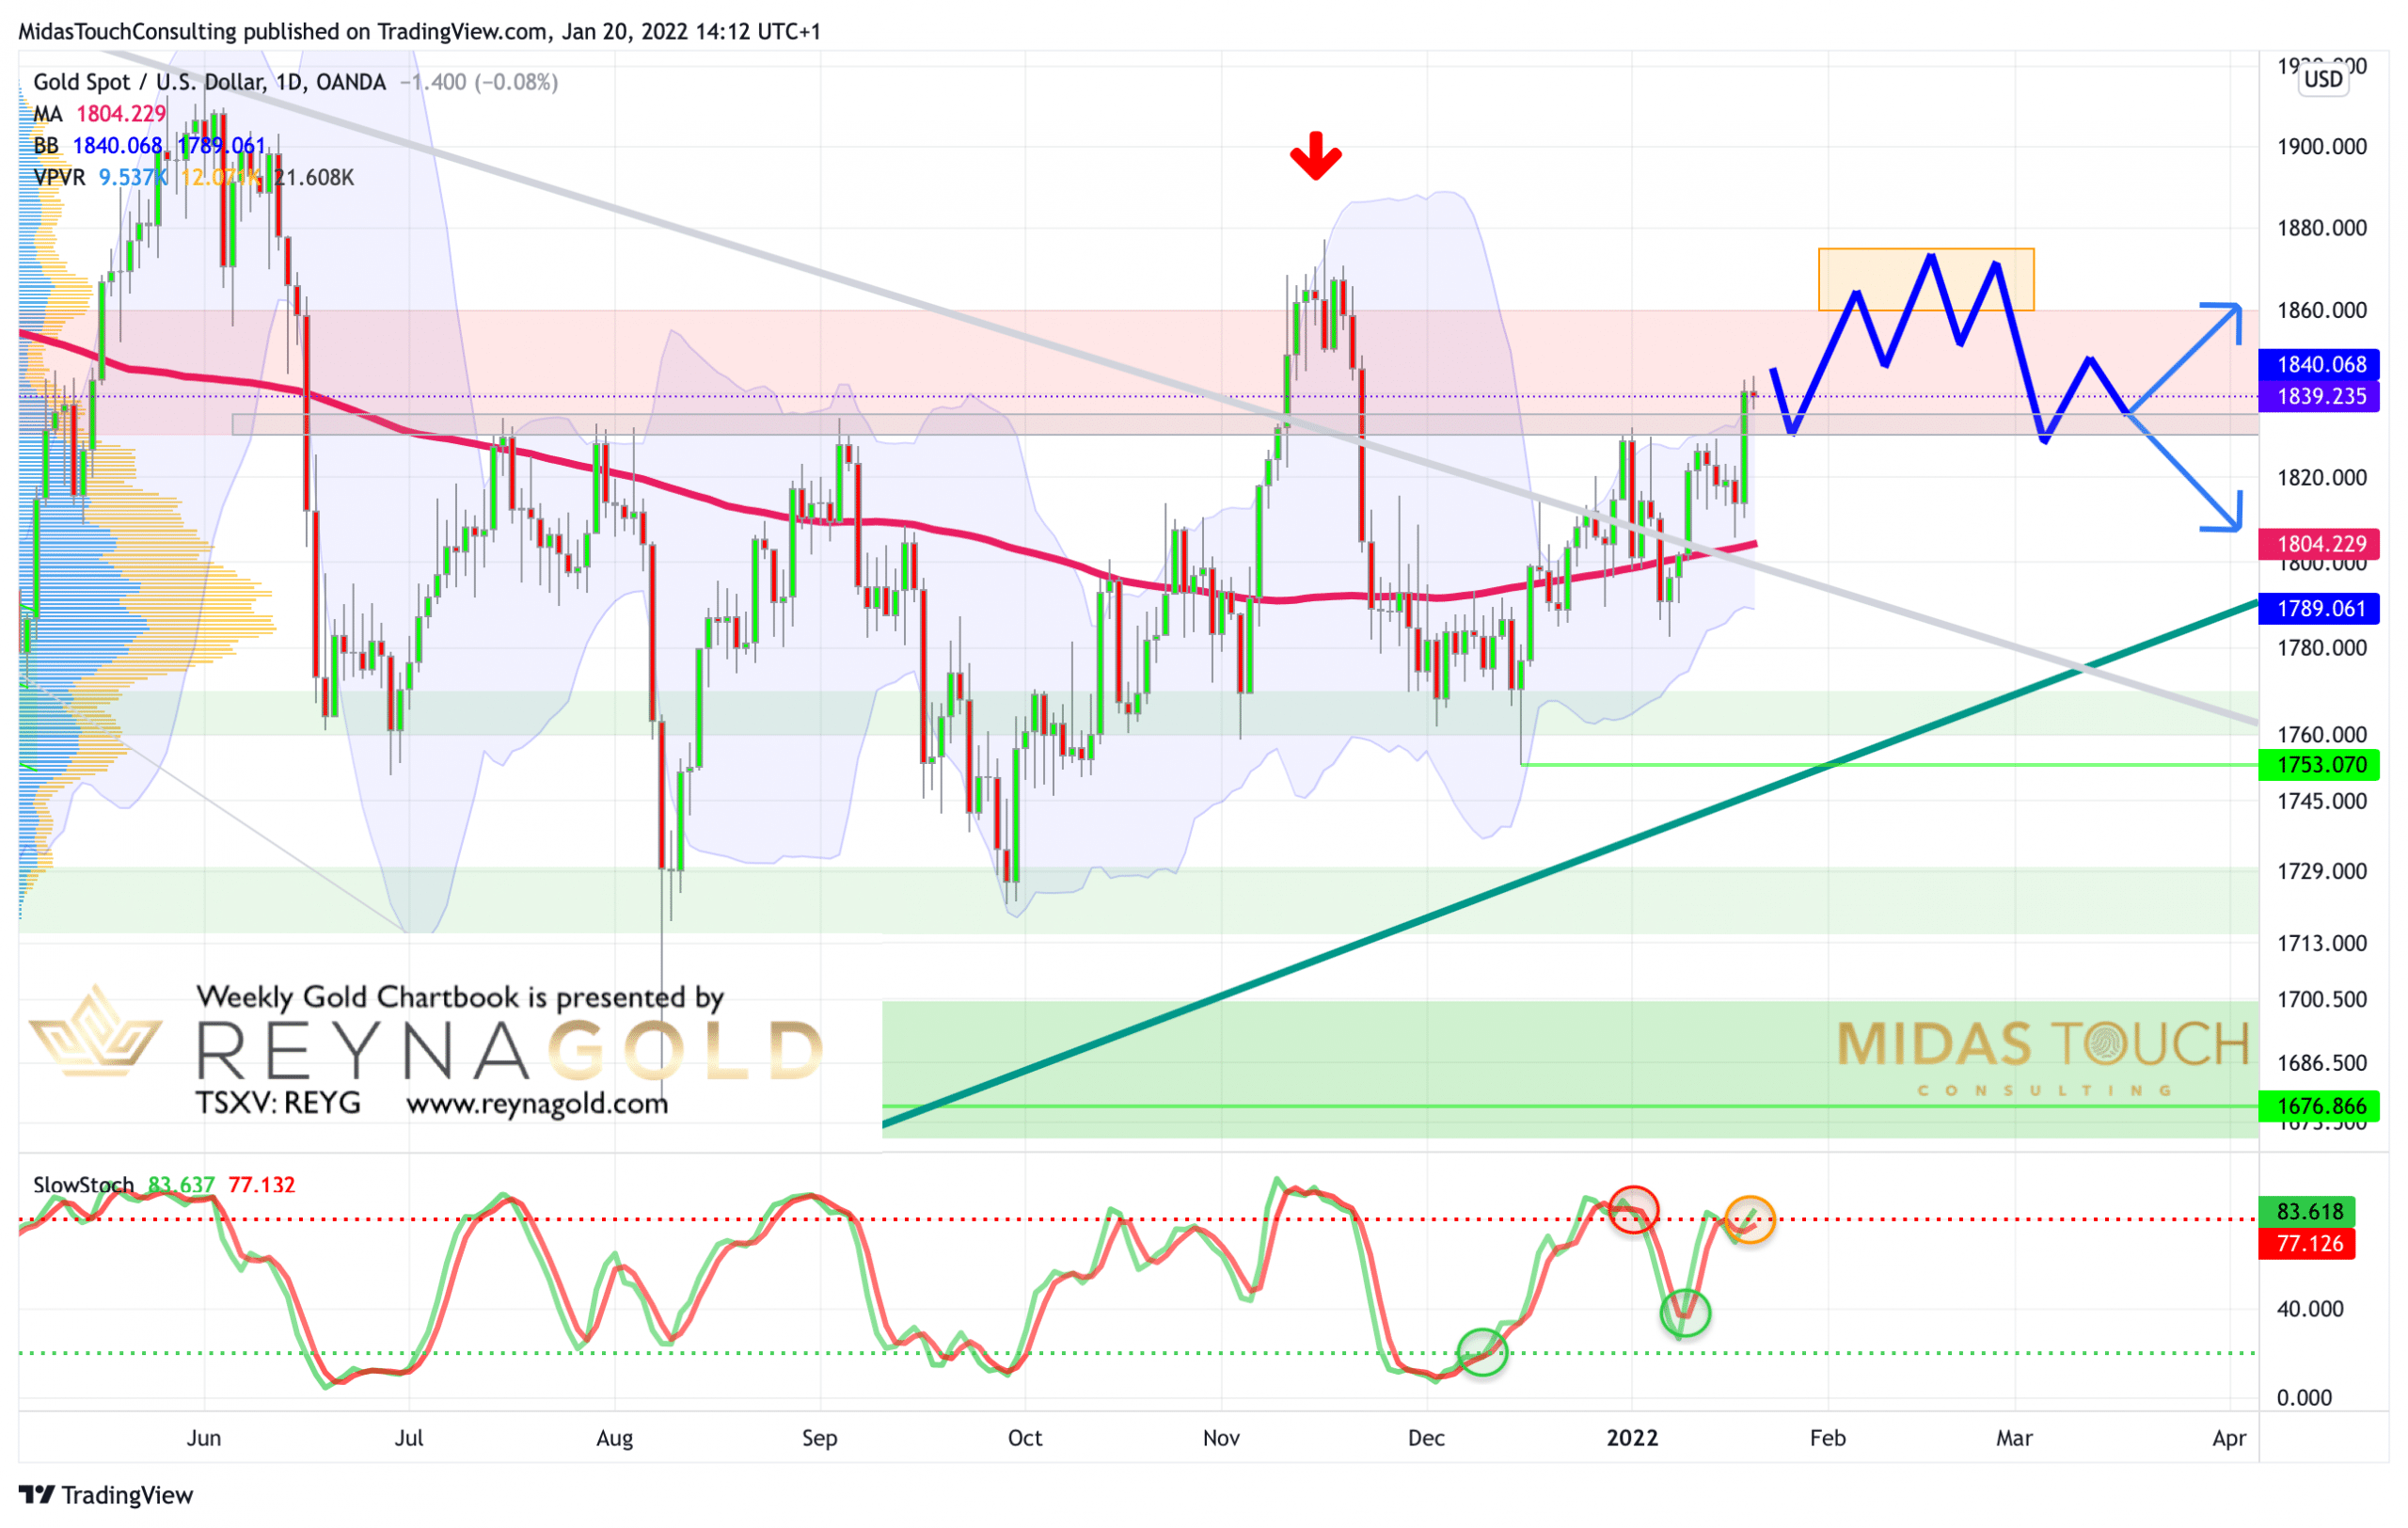
Gold in US-Dollar, daily chart as of January 20th, 2022.
Zooming into the daily chart, gold has already reached the upper bollinger band (US$1,840). Hence, there is probably little upside in the very short-term. As well, the daily stochastic oscillator is about to reach its overbought zone. Hence, the risk/reward-ratio is now unfavorable.
Despite the back and forth of recent weeks, however, an uptrend has developed. And the breakout above the resistance zone at around US$1,830 was achieved with strength and elegance. Furthermore, seasonality remains favorable for gold until the end of February. The assumption that the rally still has room is therefore justified. Likewise, and thanks to the sentiment low in December, the surprises will likely to be found on the upside for now.
The daily chart is bullish and should lead gold higher towards US$1,860 and US$1,875 over the coming weeks. However, please be warned that after starting a new year on a very bullish note, the gold market then often experienced violent pullbacks towards the end of February.
Feel free to join us in our free Telegram channel for daily real time data and a great community. If you like to get regular updates on our gold model, precious metals and cryptocurrencies you can also subscribe to our free newsletter.

