Gold – The turnaround has started.
On March 21st, Gold might finally have finished its long and tenacious eight months correction. It´s already up around US$100 from the double low at around US$1,676. Gold – The turnaround has started.
Review
After a fulminant start into the new year, the two sharp selloffs on January 6th and 8th had determined gold´s destiny for the following three months. Although gold still ran more or less sideways during January, prices quickly slipped one floor lower below US$1,800 in early February. The gold bulls could not recover from this, hence in mid-February and especially towards the end of February all dams broke and gold was sold off down to US$1,717.
In March, the sell-off initially continued down to US$1,676. Starting from this low, however, a temporarily recovery up to US$1,755 prevailed until mid-March. But this countertrend move was not sustainable as the bears quickly took control again and pushed prices down to another low of US$1,678 by March 31st.
After eight months of tough and at the end sharp correction, this double low at US$1,676 and US$1,678 finally gives the bulls some good arguments again. Thus, since that Wednesday before Easter, a more sustainable recovery has been paving its way. At US$1,758, gold prices had already gained almost USD 80 from the low in just a few days. A small pullback down to US$1,724 USD provided a breather in recent days. Since last Tuesday, however, the gold price is picking up again significantly and is manage to reach a weekly close at around US$1,775.
Overall and thanks to this double low in gold the precious metals sector has likely seen the end of the correction that began on August 7th, 2020. In the larger picture the oversold situation clearly speaks for a contrarian buying opportunity. Over the next few days and weeks, however, the bottom building formation may well drag on.
Technical Analysis: Gold in US-Dollar
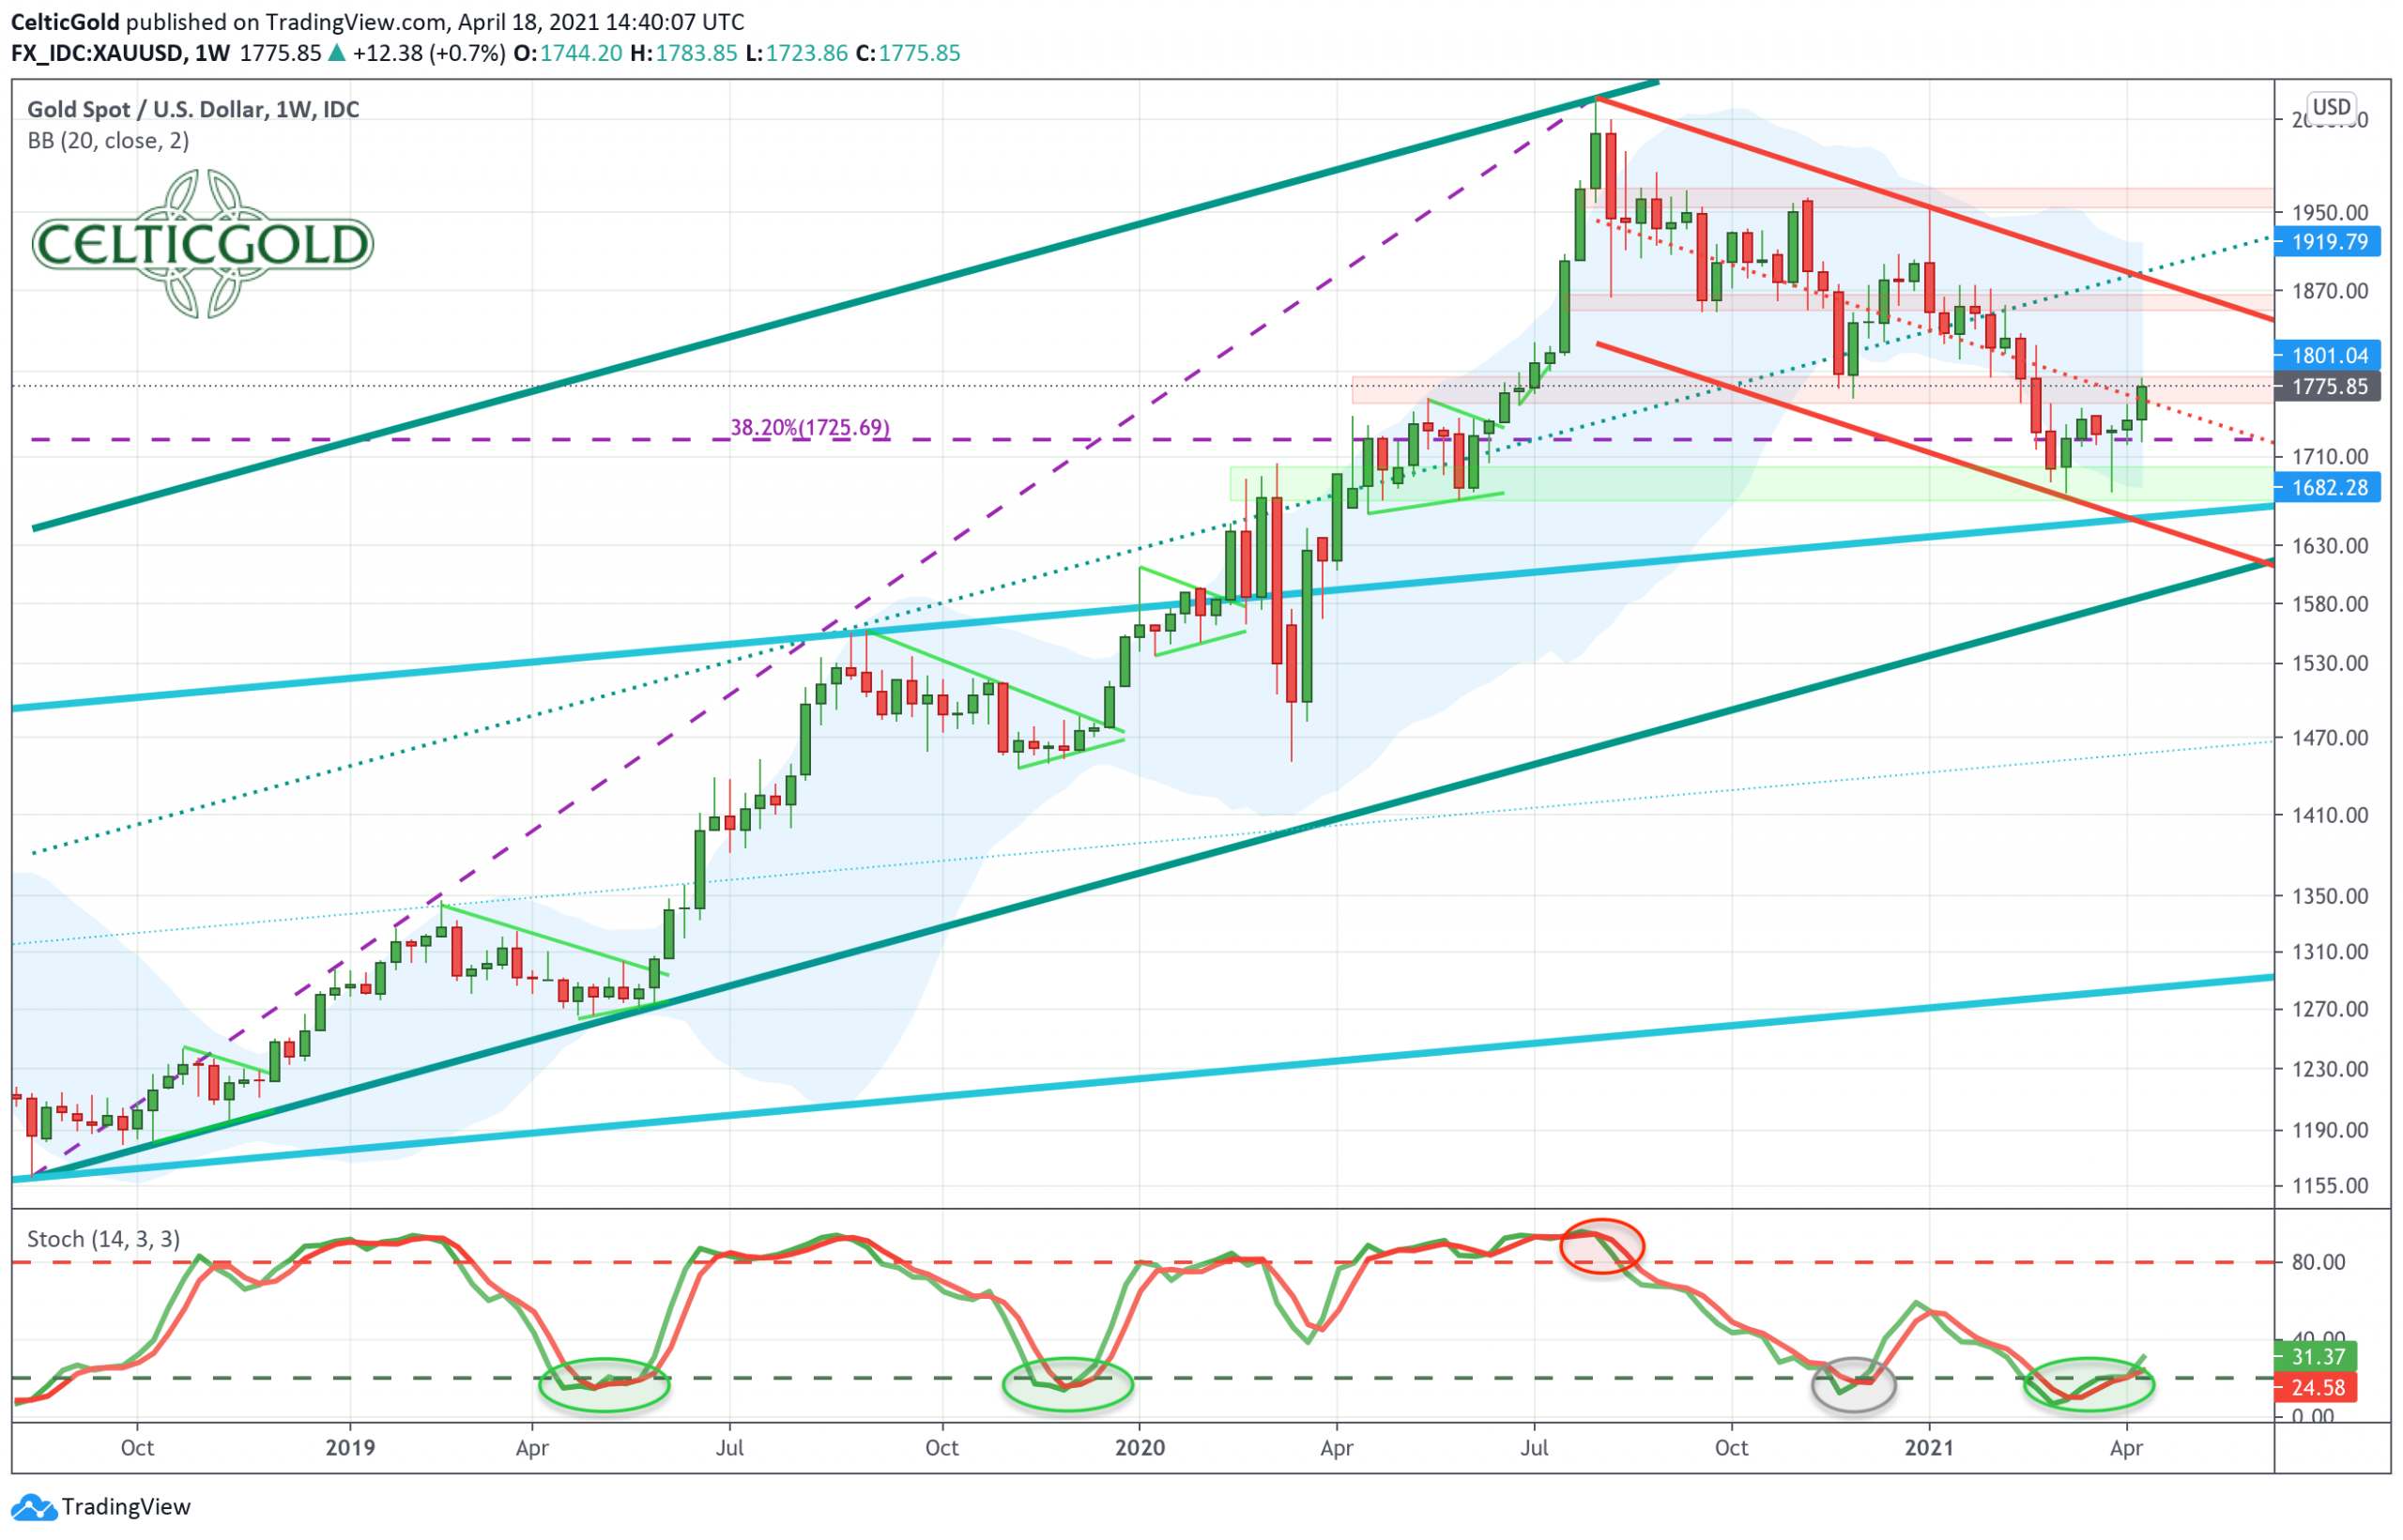
Gold in US-Dollars, weekly chart as of April 18th, 2021. Source: Tradingview
On the weekly chart, gold continues to move in a solid upward trend channel in the big picture. The correction of the last eight months had become necessary in the summer of 2020 due to an overheated sentiment and widespread euphoria. Hence and so far, this pullback only represents a healthy breather. The decline from the new all-time high (US$ 2,075) is also within reasonable bounds at 19.2% in absolute terms. Physical gold investors should have had no problems at all with this manageable pullback. On the other hand, those who have been in the gold market with leverage and margin are likely to have experienced an extremely difficult market phase in recent months.
Fortunately, the correction has not only ensured a complete clearing up of the overbought situation in the gold market. Rather, the oversold weekly stochastic now points to a contrarian buying opportunity. In the last two and a half years, such a situation in the stochastic oscillator always provided for a significant rally after a bottoming phase.
However, in the last few months, quite a bit has been broken on the chart. Hence, the gold bulls now have a lot of work ahead of them. In particular, gold needs to break out of its subordinate downward trend channel in red over the further course of this year. For this, it needs a clear breakout above the well-known resistance zone around US$ 1,850. How long this task will take, cannot yet be estimated exactly. In the best-case scenario, the breakout will be successful by early summer. Alternatively, this venture can also drag on into the 3rd quarter.
On the downside, the psychological mark of US$1,700 should not be taken out anymore. Otherwise, the question marks are increasing regarding whether the gold price has actually found its low and is currently tinkering with a bottom formation with a subsequent new upward trend.
All in all, gold in a well stabled uptrend on its weekly chart. At the same time, however, the downtrend in place since August is still active too. If the bull market can reassert itself, gold prices should be able to leave the red downtrend channel to the upside in the next few months. However, this task will take time and energy, which will ultimately once again test the patience of investors.

Gold in US-Dollars, daily chart as of April 18th, 2021. Source: Tradingview
On the daily chart, the most important message is the double low at US$1,676 and US$1,678. After all, there were a good three weeks between those two lows, hence one can definitely speak of significance here. At the same time, the stochastic oscillator has recently marked a higher low. I.e., the momentum of the second low was significantly lower. Since March 31, the bulls have therefore started a counterattack or recovery/bounce. With a rise of a more than US$100 to a weekly close at US$1,775, gold has been able to achieve a small success. Now, however, it must continue to rise gradually, otherwise the trend reversal will quickly falter again.
Of course, a multi-week bottoming between US$1,700 and US$1,785 is also possible. But last Friday, our first resistance and target zone at around US$1,770 to US$1,785 was somewhat met. Subsequently, instead of a larger consolidation a simple back and forth around the middle downtrend line would be conceivable. Only then should the gold market be ready for an attack on the well-known resistance zone around US$1,850. The important 200-day moving average (US$1,857) also sits in this area, which confirms US$1,850 as our logical 2nd recovery target. However, for the advance into this range, the gold price could well need several weeks or possibly one to three months.
In summary, the daily chart makes a constructive impression. Although one cannot really speak of a new up-trend yet, the recovery over the last two and a half weeks looks like game changer. Therefore, the 2nd target zone around US$1,850 should be reached in the coming weeks or months.
Commitments of Traders for Gold – The turnaround has started.
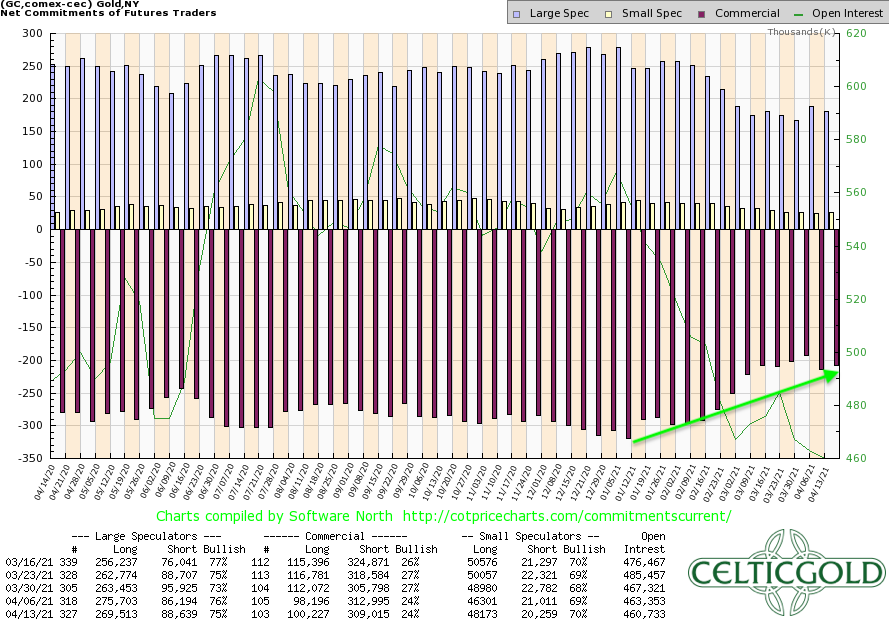
Commitments of Traders for Gold as of April 18th, 2021. Source: CoT Price Charts
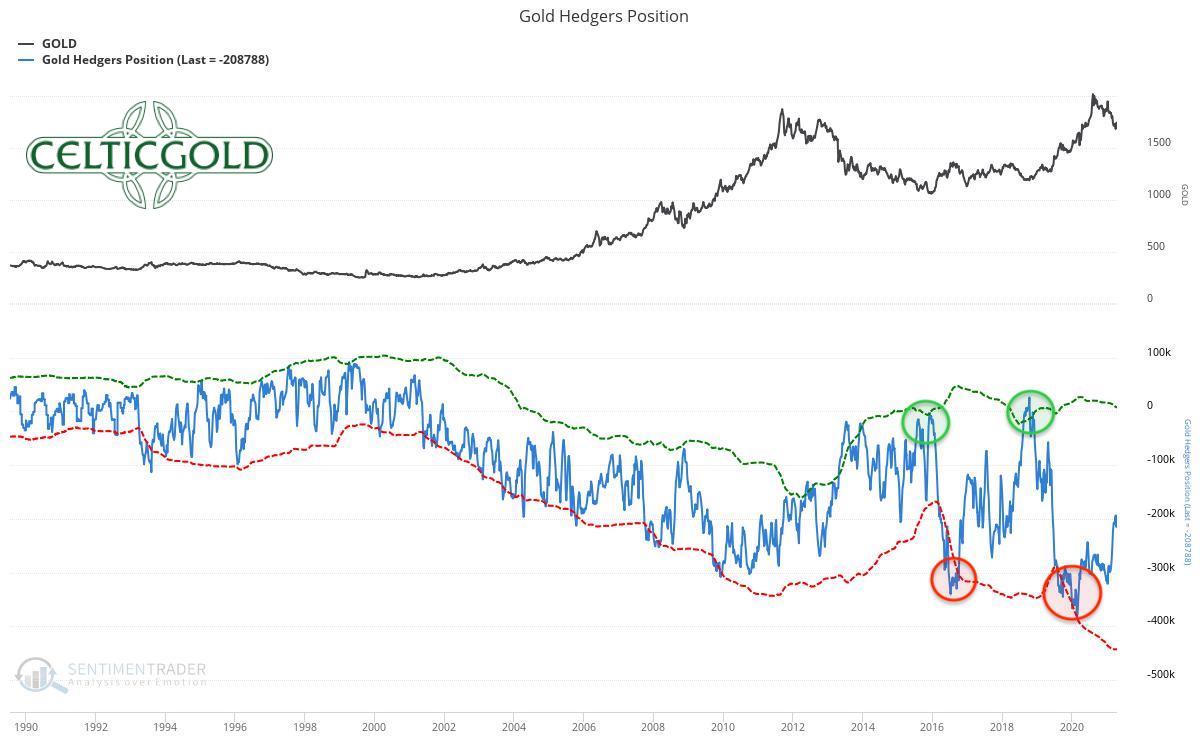
Since the beginning of the year, commercial traders have reduced their cumulative net short position in the gold futures market by over 33%. Most recently it was down from 320,923 to 208,788 contracts sold short. In the week before, this net short position had increased slightly by 21,073 short contracts in the wake of rising gold prices.
In the big picture, one can currently speak of a neutral constellation in the futures market at best, as the current net short position remains relatively high in a long-term comparison.
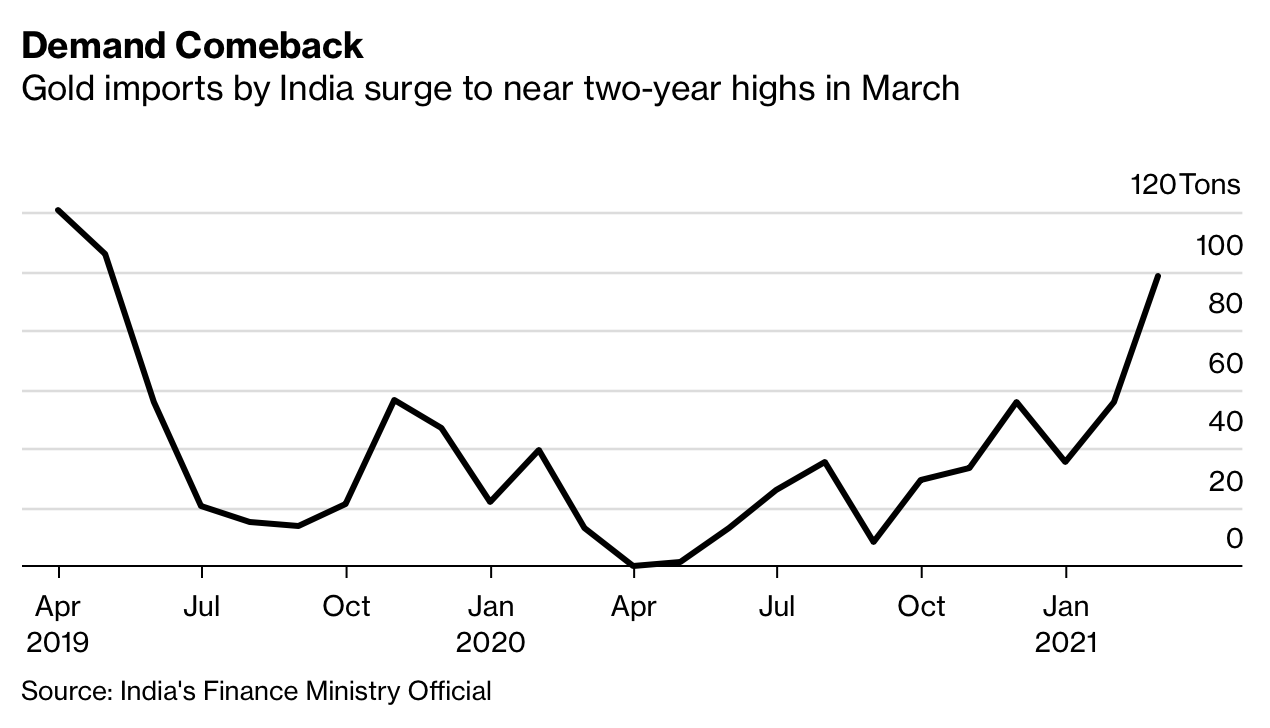
At the same time, of course, it must be mentioned that the physical market has become very tight due to the eight months correction in gold prices. For example, Indian gold imports already rose in March to the highest monthly level in almost two years. According to Bloomberg, imports to the world’s second-largest gold consumer country more than doubled to nearly 190 tons in the first three months of 2021.
In summary, the CoT report continues to urge caution and patience. However, there are increasing signs that the physical gold market has now bottomed and the exaggerated sell-off in the paper gold markets has therefore ended.
Sentiment: Gold – The turnaround has started.
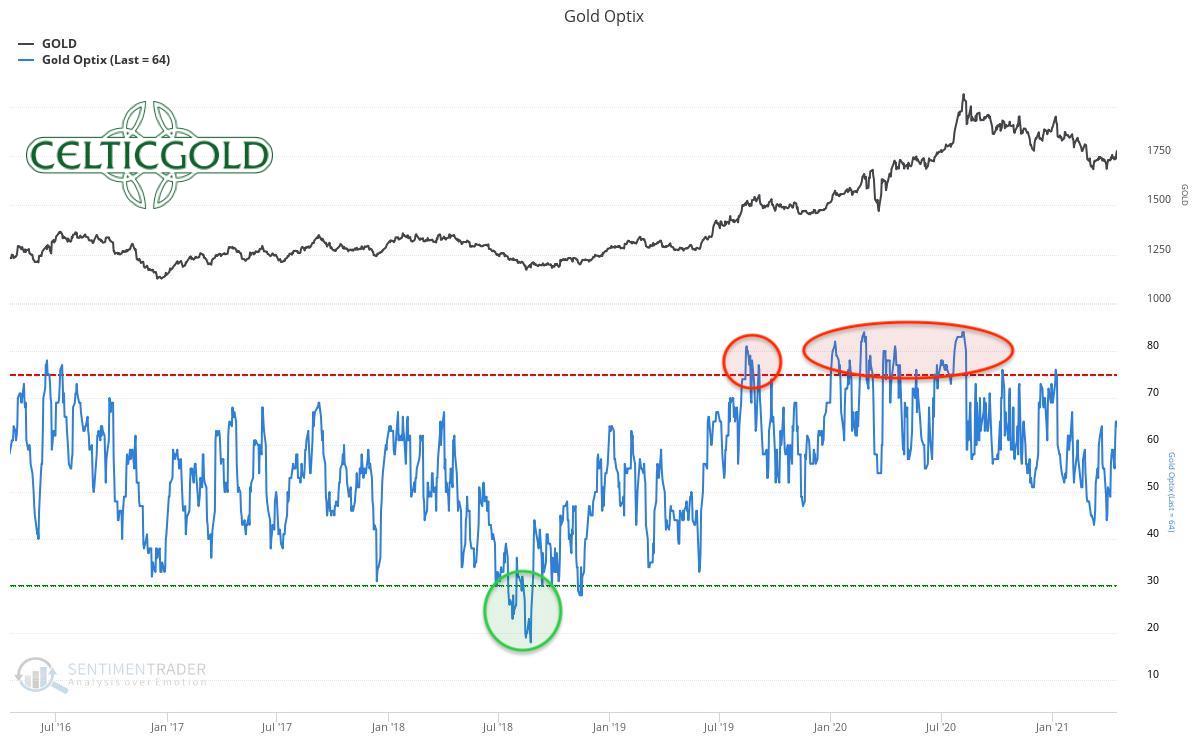
The long and tenacious correction since August 7th, 2020 has certainly not pushed gold´s sentiment numbers to an extreme panic low as in August 2018. But nevertheless, one can at least speak of a complete clearing of the euphoric mood of last summer. Thus, quantitative sentiment data is currently clearly in neutral territory.
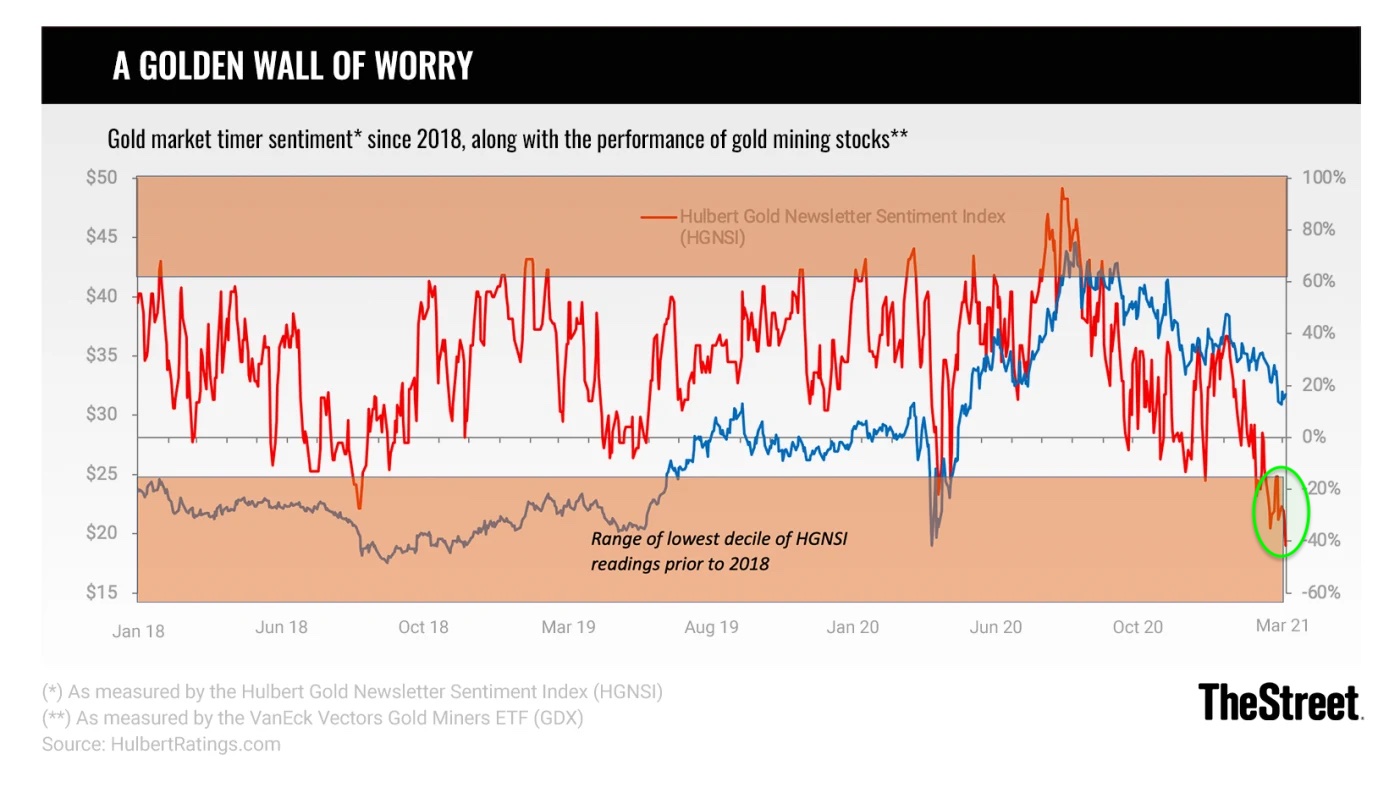
In the short term, however, the mood among gold newsletter writers had become extremely pessimistic in March. Thus, on March 10th the Hullbert Gold Newsletter Sentiment Index hit its lowest level in the last three years. Statistically, however, gold prices do exactly the opposite in such extreme sentiment situations and should therefore move significantly higher in the coming two to three months.
Overall, the sentiment analysis now finally provides a thoroughly promising set up again. Since dramatic panic selloffs very rarely occur in a bull market, the chances for a major recovery are good in view of the neutral sentiment.
Seasonality: Gold – The turnaround has started.
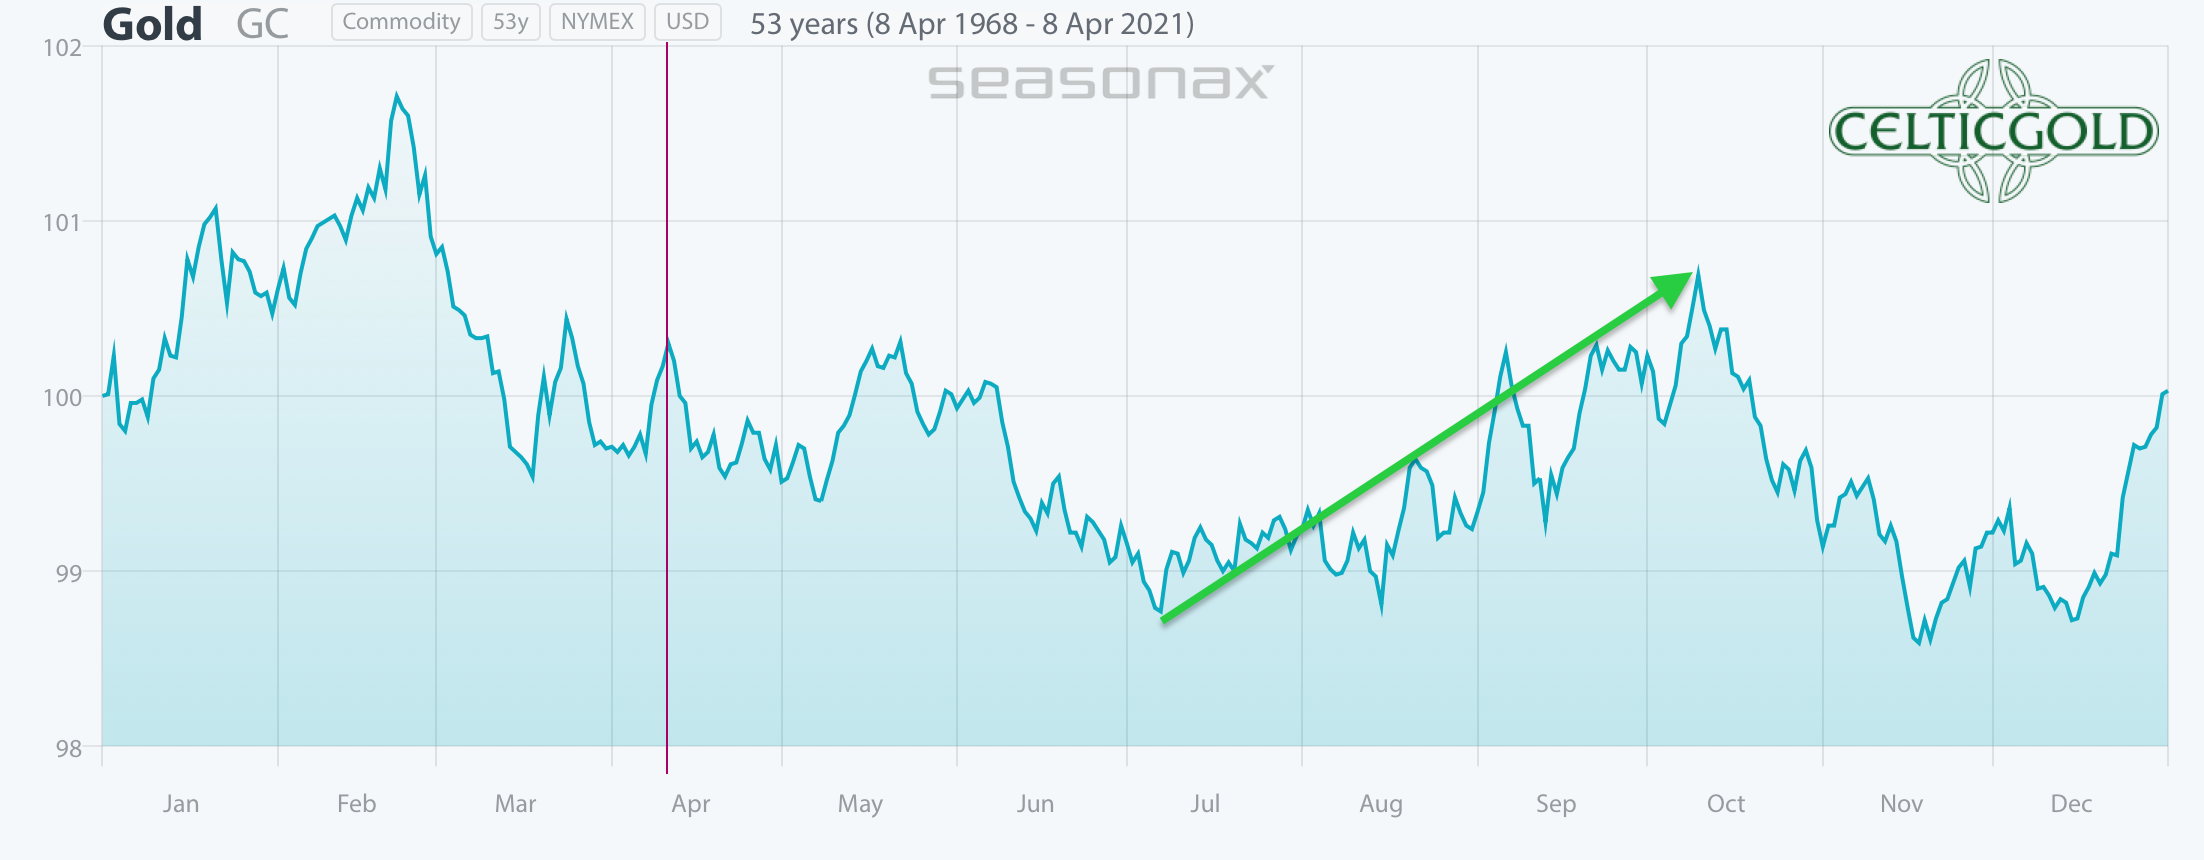
Seasonality for Gold as of April 11th, 2021. Source: Seasonax
In the current year, the gold price seems to be running two months ahead of its seasonal pattern established over decades. The top on January 6th was followed by a clear wave down lasting almost three months until the end of March. This correction would actually have been more typical for the period March to June.
With the double low reached at the end of March, the beginning of the usually strong summer phase would be conceivable from May or June this year. In the short term, seasonality continues to urge patience. At the very latest, the gold price should be able to take off again from the beginning of July.
Sound Money: Bitcoin/Gold-Ratio

Sound Money Bitcoin/Gold-Ratio as of April 11th, 2021. Source: Chaia
With prices of approx. US$55,000 for one Bitcoin and US$1,775 for one troy ounce of gold, the Bitcoin/Gold-ratio is currently sitting at around 31. That means you now have to pay 31 ounces of gold for one Bitcoin. Put the other way around, an ounce of gold currently only costs 0.032 Bitcoin. Thus, Bitcoin has continued to outperform gold in recent weeks. We had warned of this development since early summer last year!
Generally, you should be invested in both: precious metals and bitcoin. Buying and selling Bitcoin against gold only makes sense to the extent that one balances the allocation in these two asset classes! At least 10% but better 25% of one’s total assets should be invested in precious metals (preferably physically), while in cryptos and especially in Bitcoin, one should hold at least 1% to 5%. Paul Tudor Jones holds a little less than 2% of his assets in Bitcoin. If you are very familiar with cryptocurrencies and Bitcoin, you can certainly allocate higher percentages to Bitcoin and maybe other Altcoins on an individual basis. For the average investor, who usually is primarily invested in equities and real estate, 5% in the highly speculative and highly volatile bitcoin is already a lot!
“Opposites complement. In our dualistic world of Yin and Yang, body and mind, up and down, warm and cold, we are bound by the necessary attraction of opposites. In this sense you can view gold and bitcoin as such a pair of strength. With the physical component of gold and the digital aspect of bitcoin (BTC-USD) you have a complementary unit of a true safe haven in the 21st century. You want to own both!”– Florian Grummes
Macro update and Crack-up-Boom:
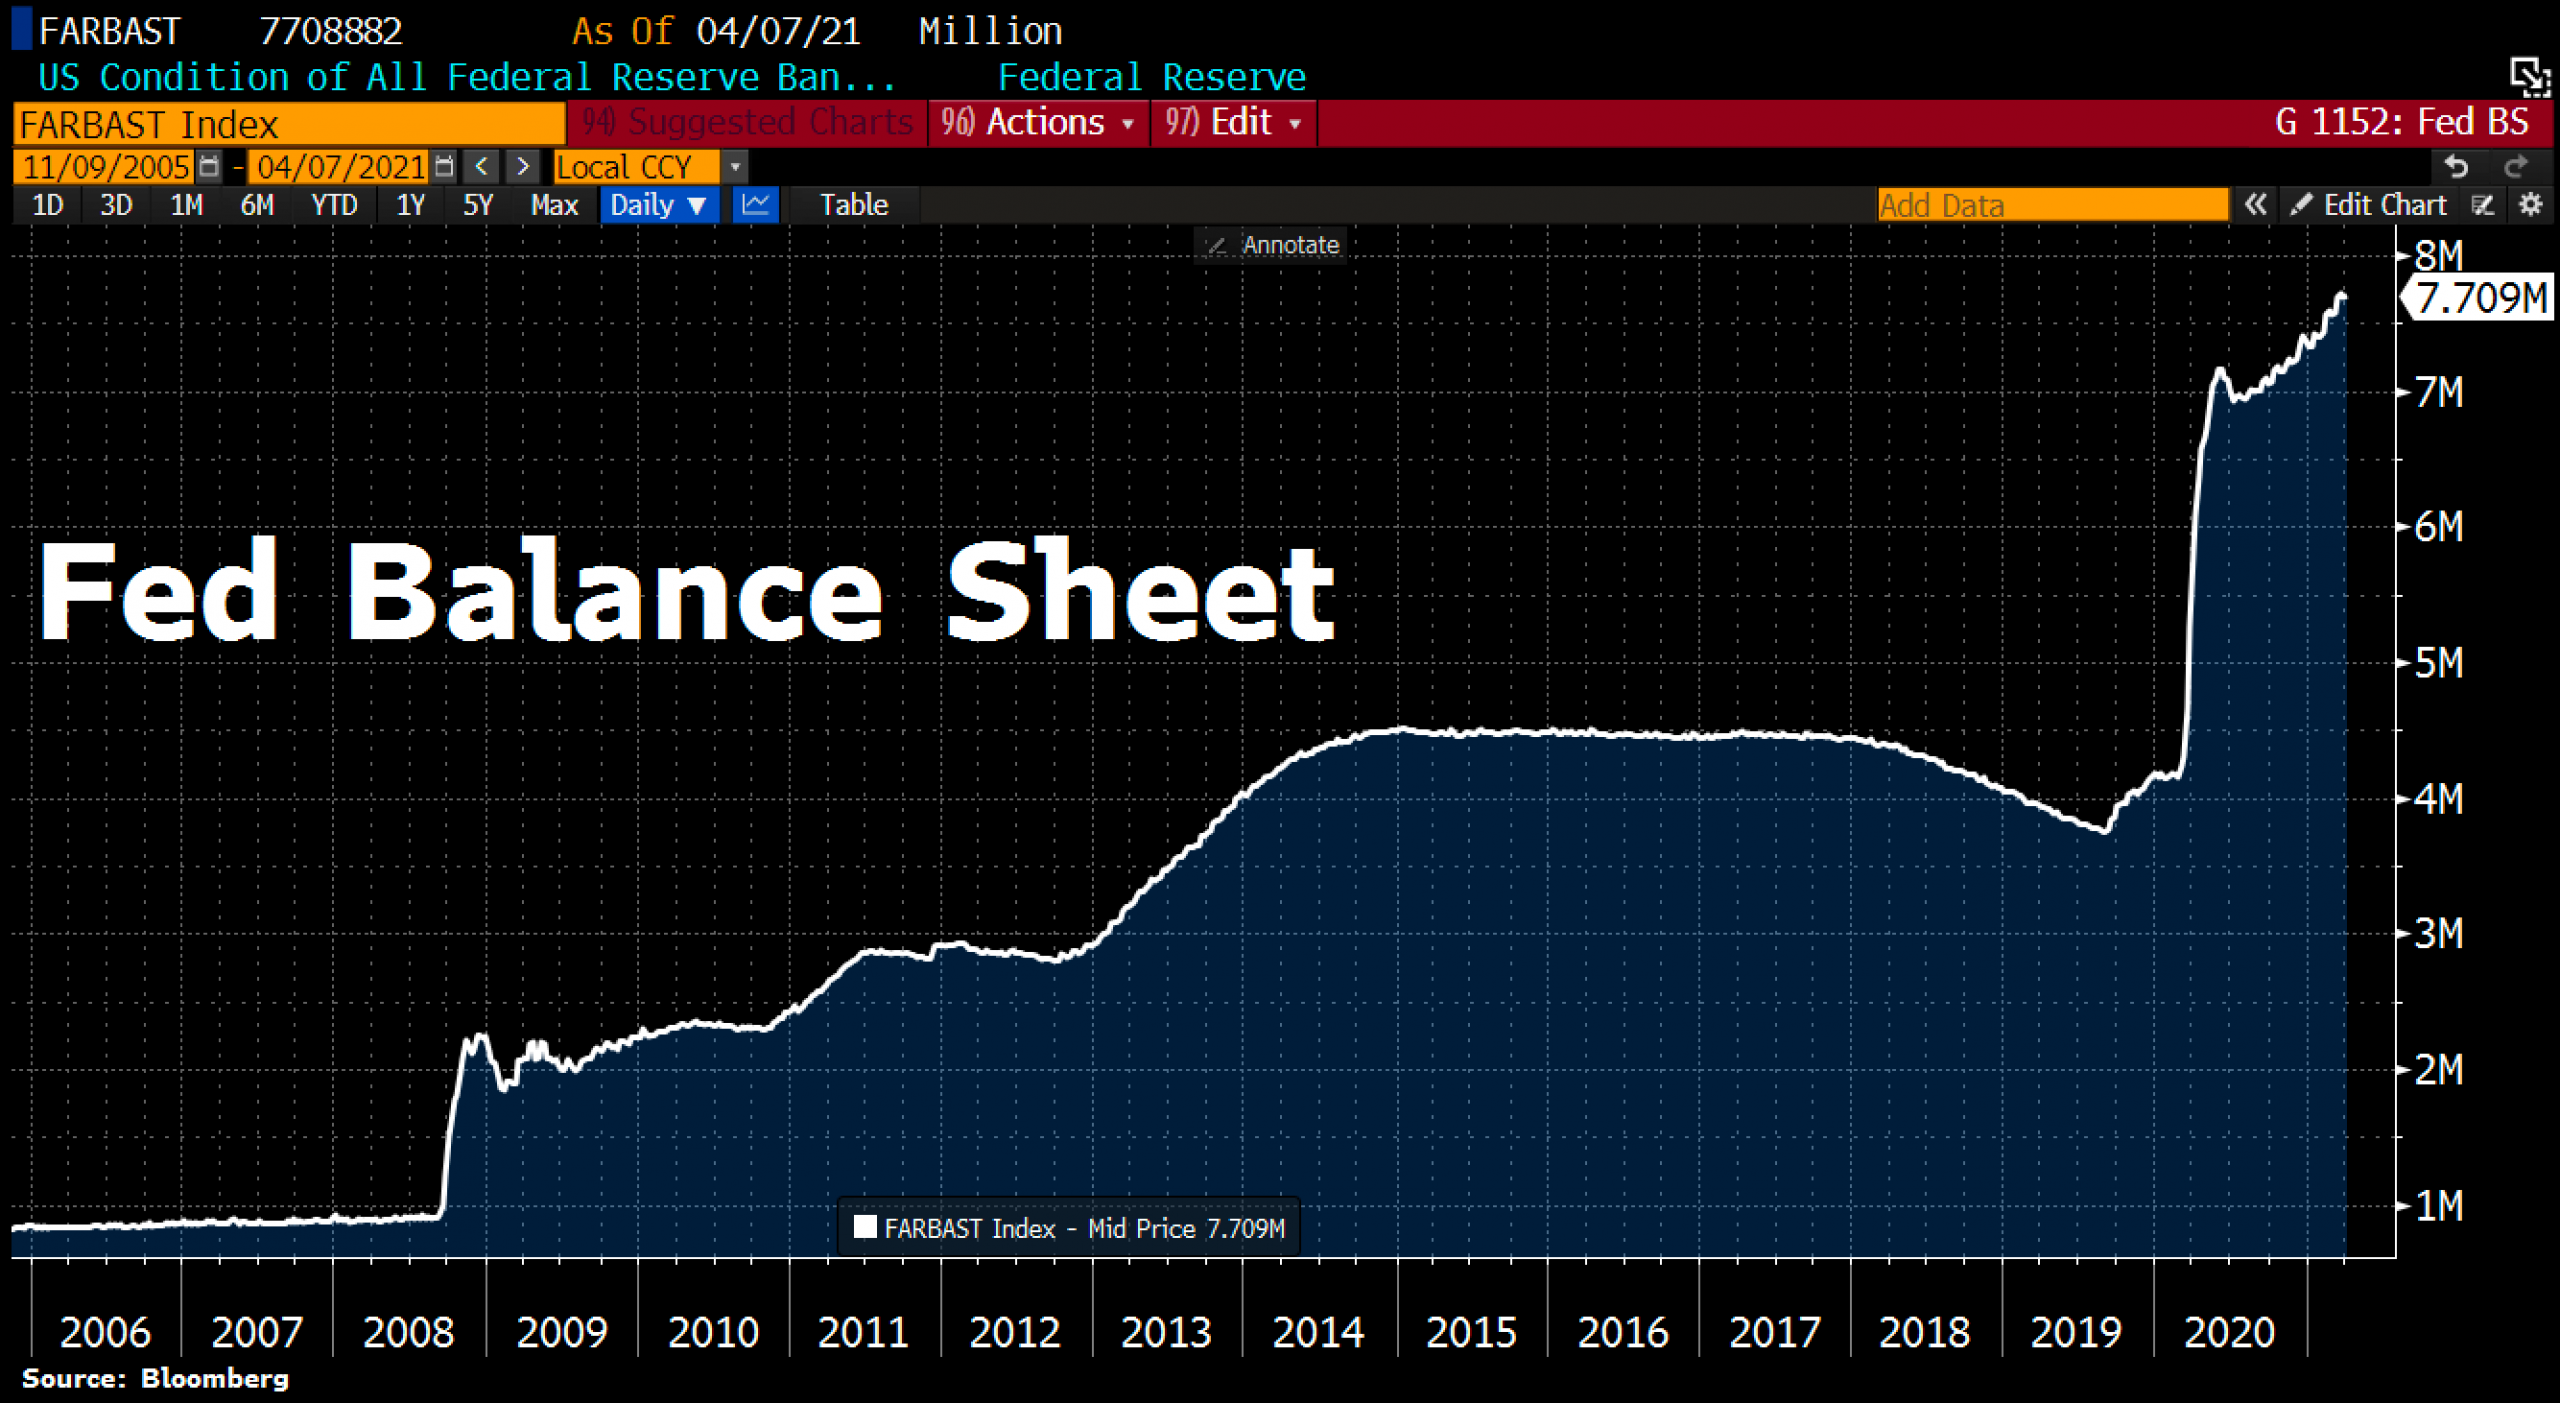
As clearly and unambiguously suspected at this point time and again, central banks around the world continue to expand their balance sheets. For example, as of April 7th, the FED’s total assets rose to a new all-time high of US$7,709 billion. The increase in assets was driven mainly by continued purchases of government bonds and a modest increase in the PPP loan financing facility.
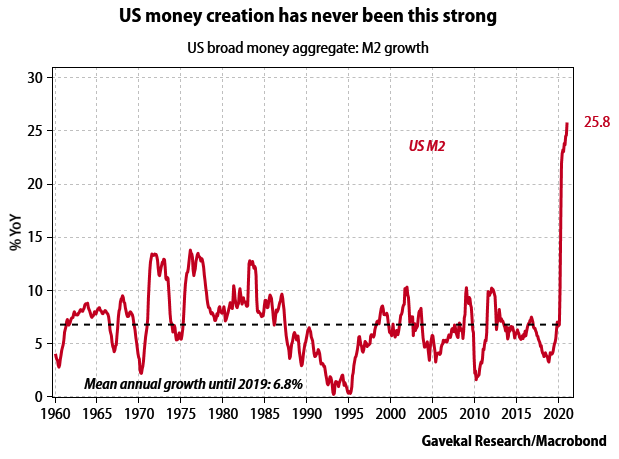
To put things in perspective, it is important for investors to be aware of how fast and strong U.S. money creation (as measured by growth in broad monetary aggregate M2) has been exploding for well over a year now.
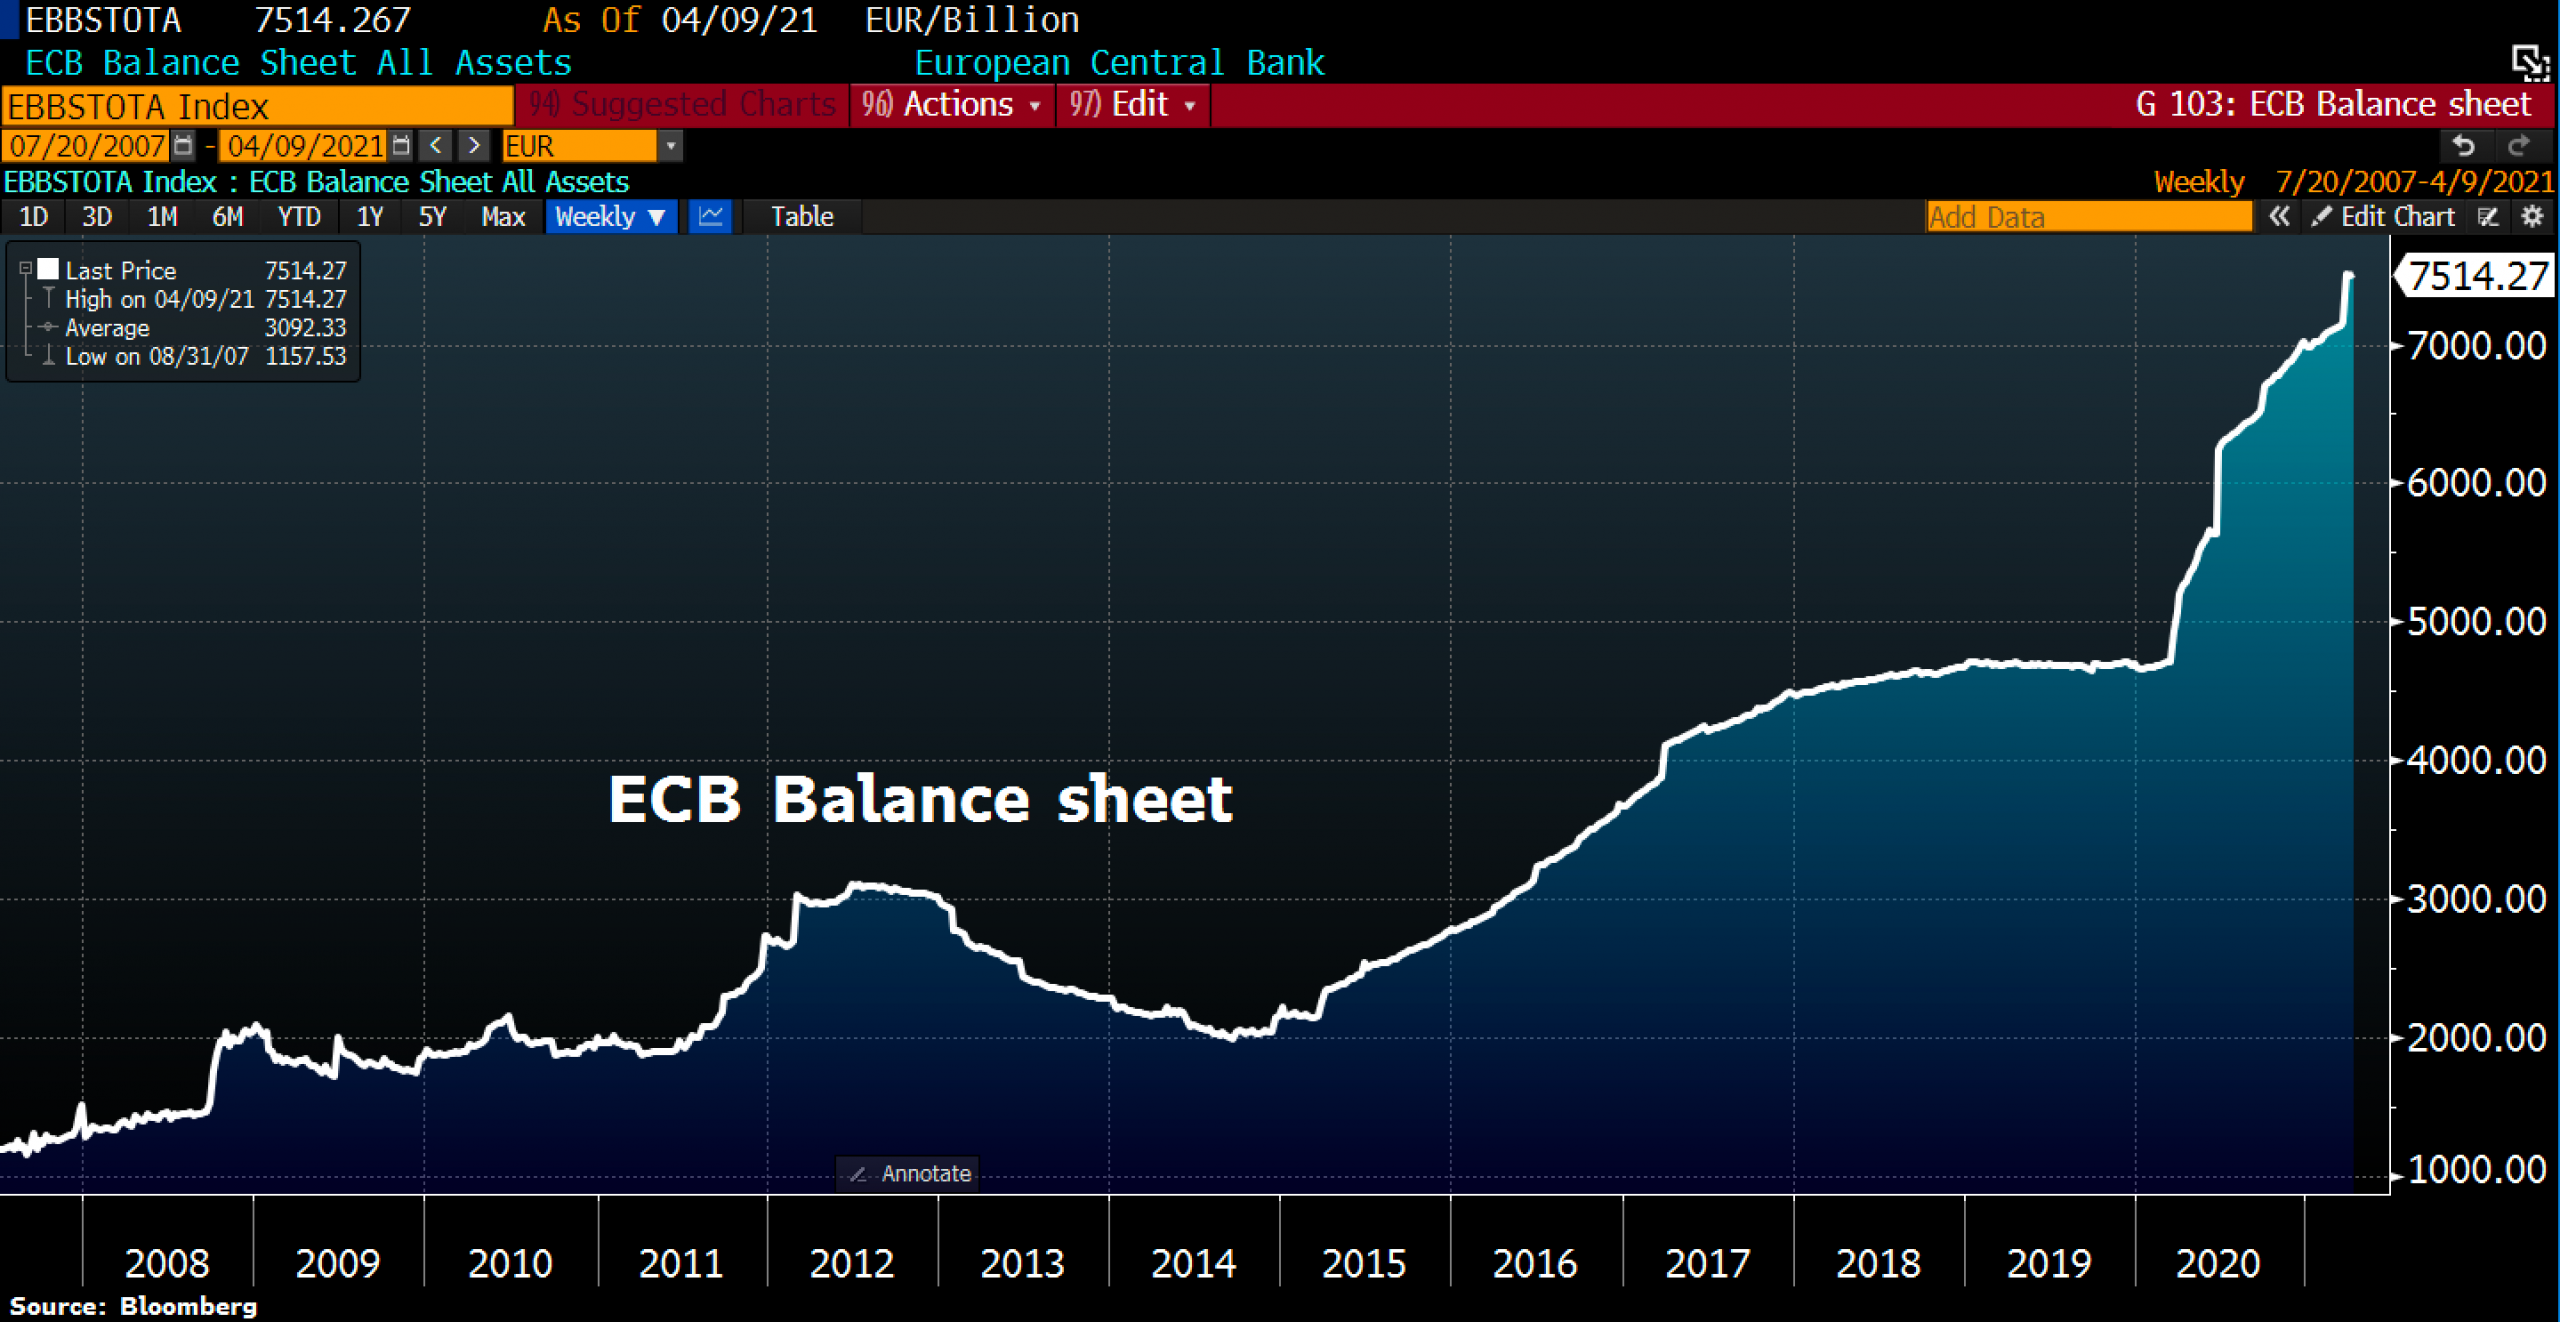
In principle, currency creation continues briskly in the eurozone as well. However, at the beginning of April, the ECB balance sheet had temporarily shrunk slightly for the first time since January and amounted to 7,494 billion EUR as of April 2nd. Although Ms. Lagarde keeps the printing press running, the quarterly revaluation of gold reserves as well as other assets had caused the central bank balance sheet to shrink by around 11 billion EUR.
However, the very latest figures again confirm the money-printing orgy, as the balance sheet number grew strongly again compared to the week before, reaching a new all-time high of 7,514 billion EUR. The bloated ECB balance sheet is now equivalent to 70% of eurozone GDP. Since the beginning of the year, the ECB balance sheet has now increased further by more than 7% in just three months.
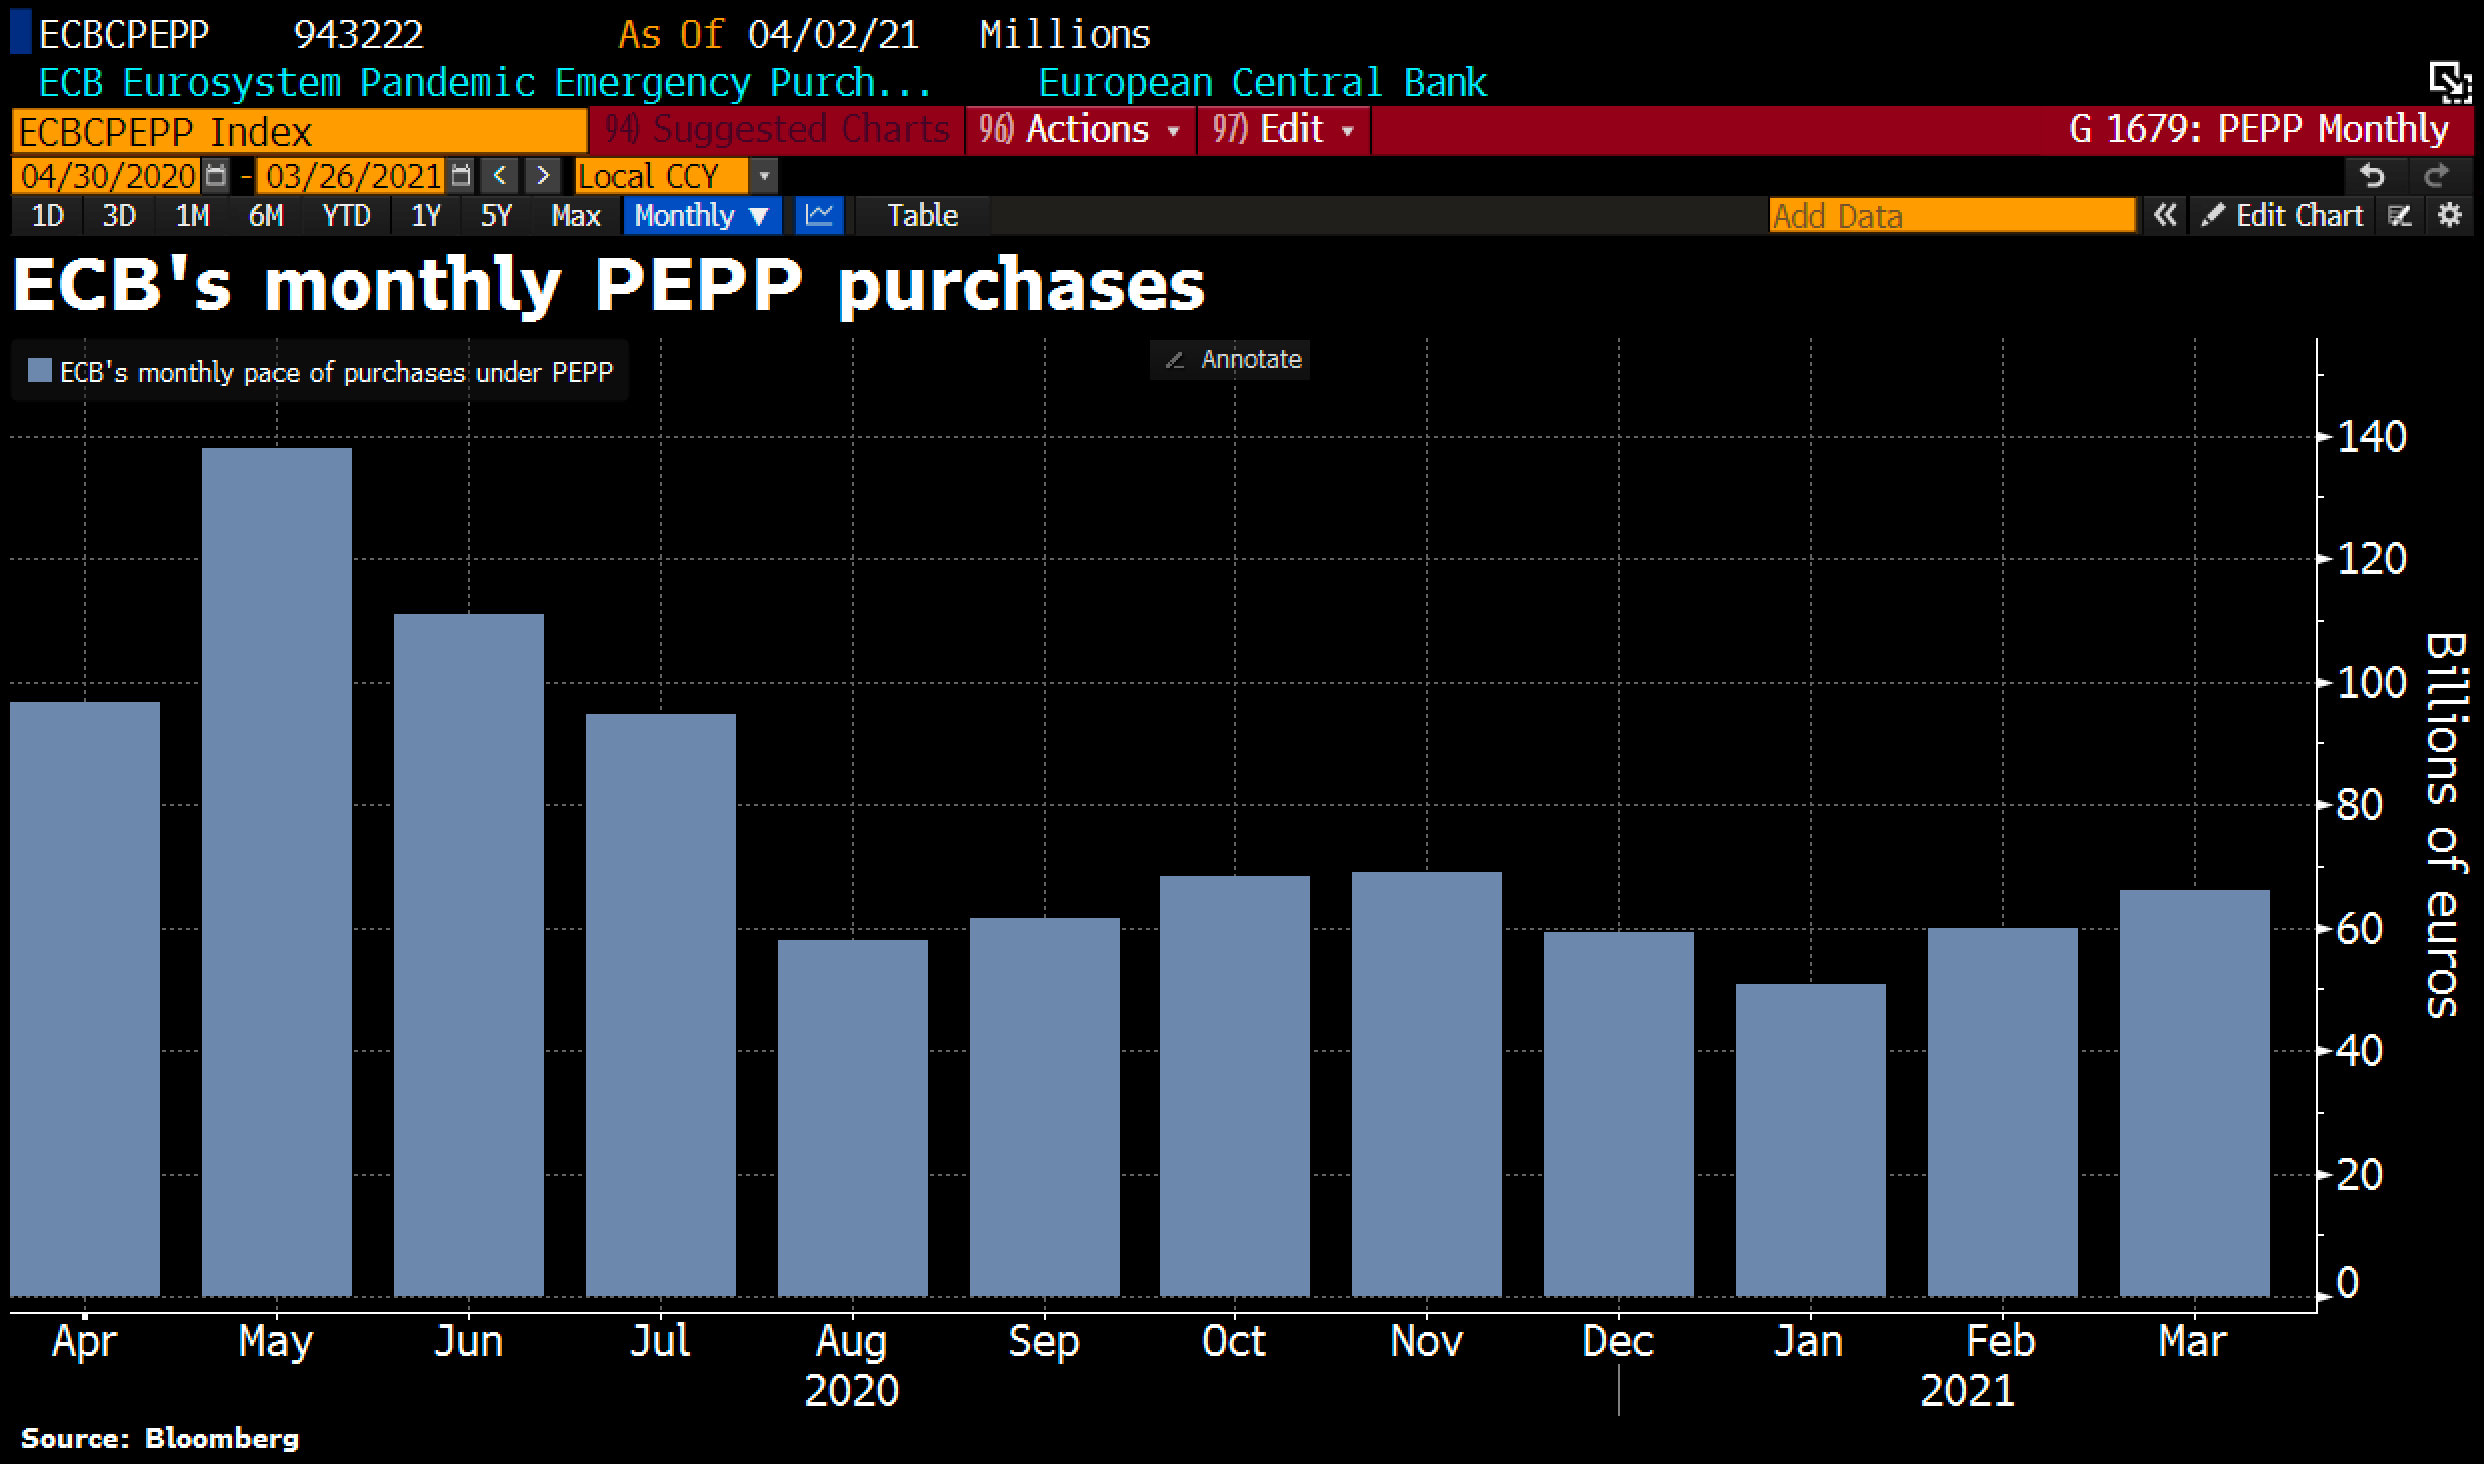
Overall, the ECB accelerated the pace of its Pandemic Emergency Purchase Program (PEPP) in March. The biggest beneficiary of the money printing was Germany, with German government bonds taking the lion’s share in February and March at 44.8 billion EUR. In total, the ECB bought bonds worth 73.5 billion EUR last month.
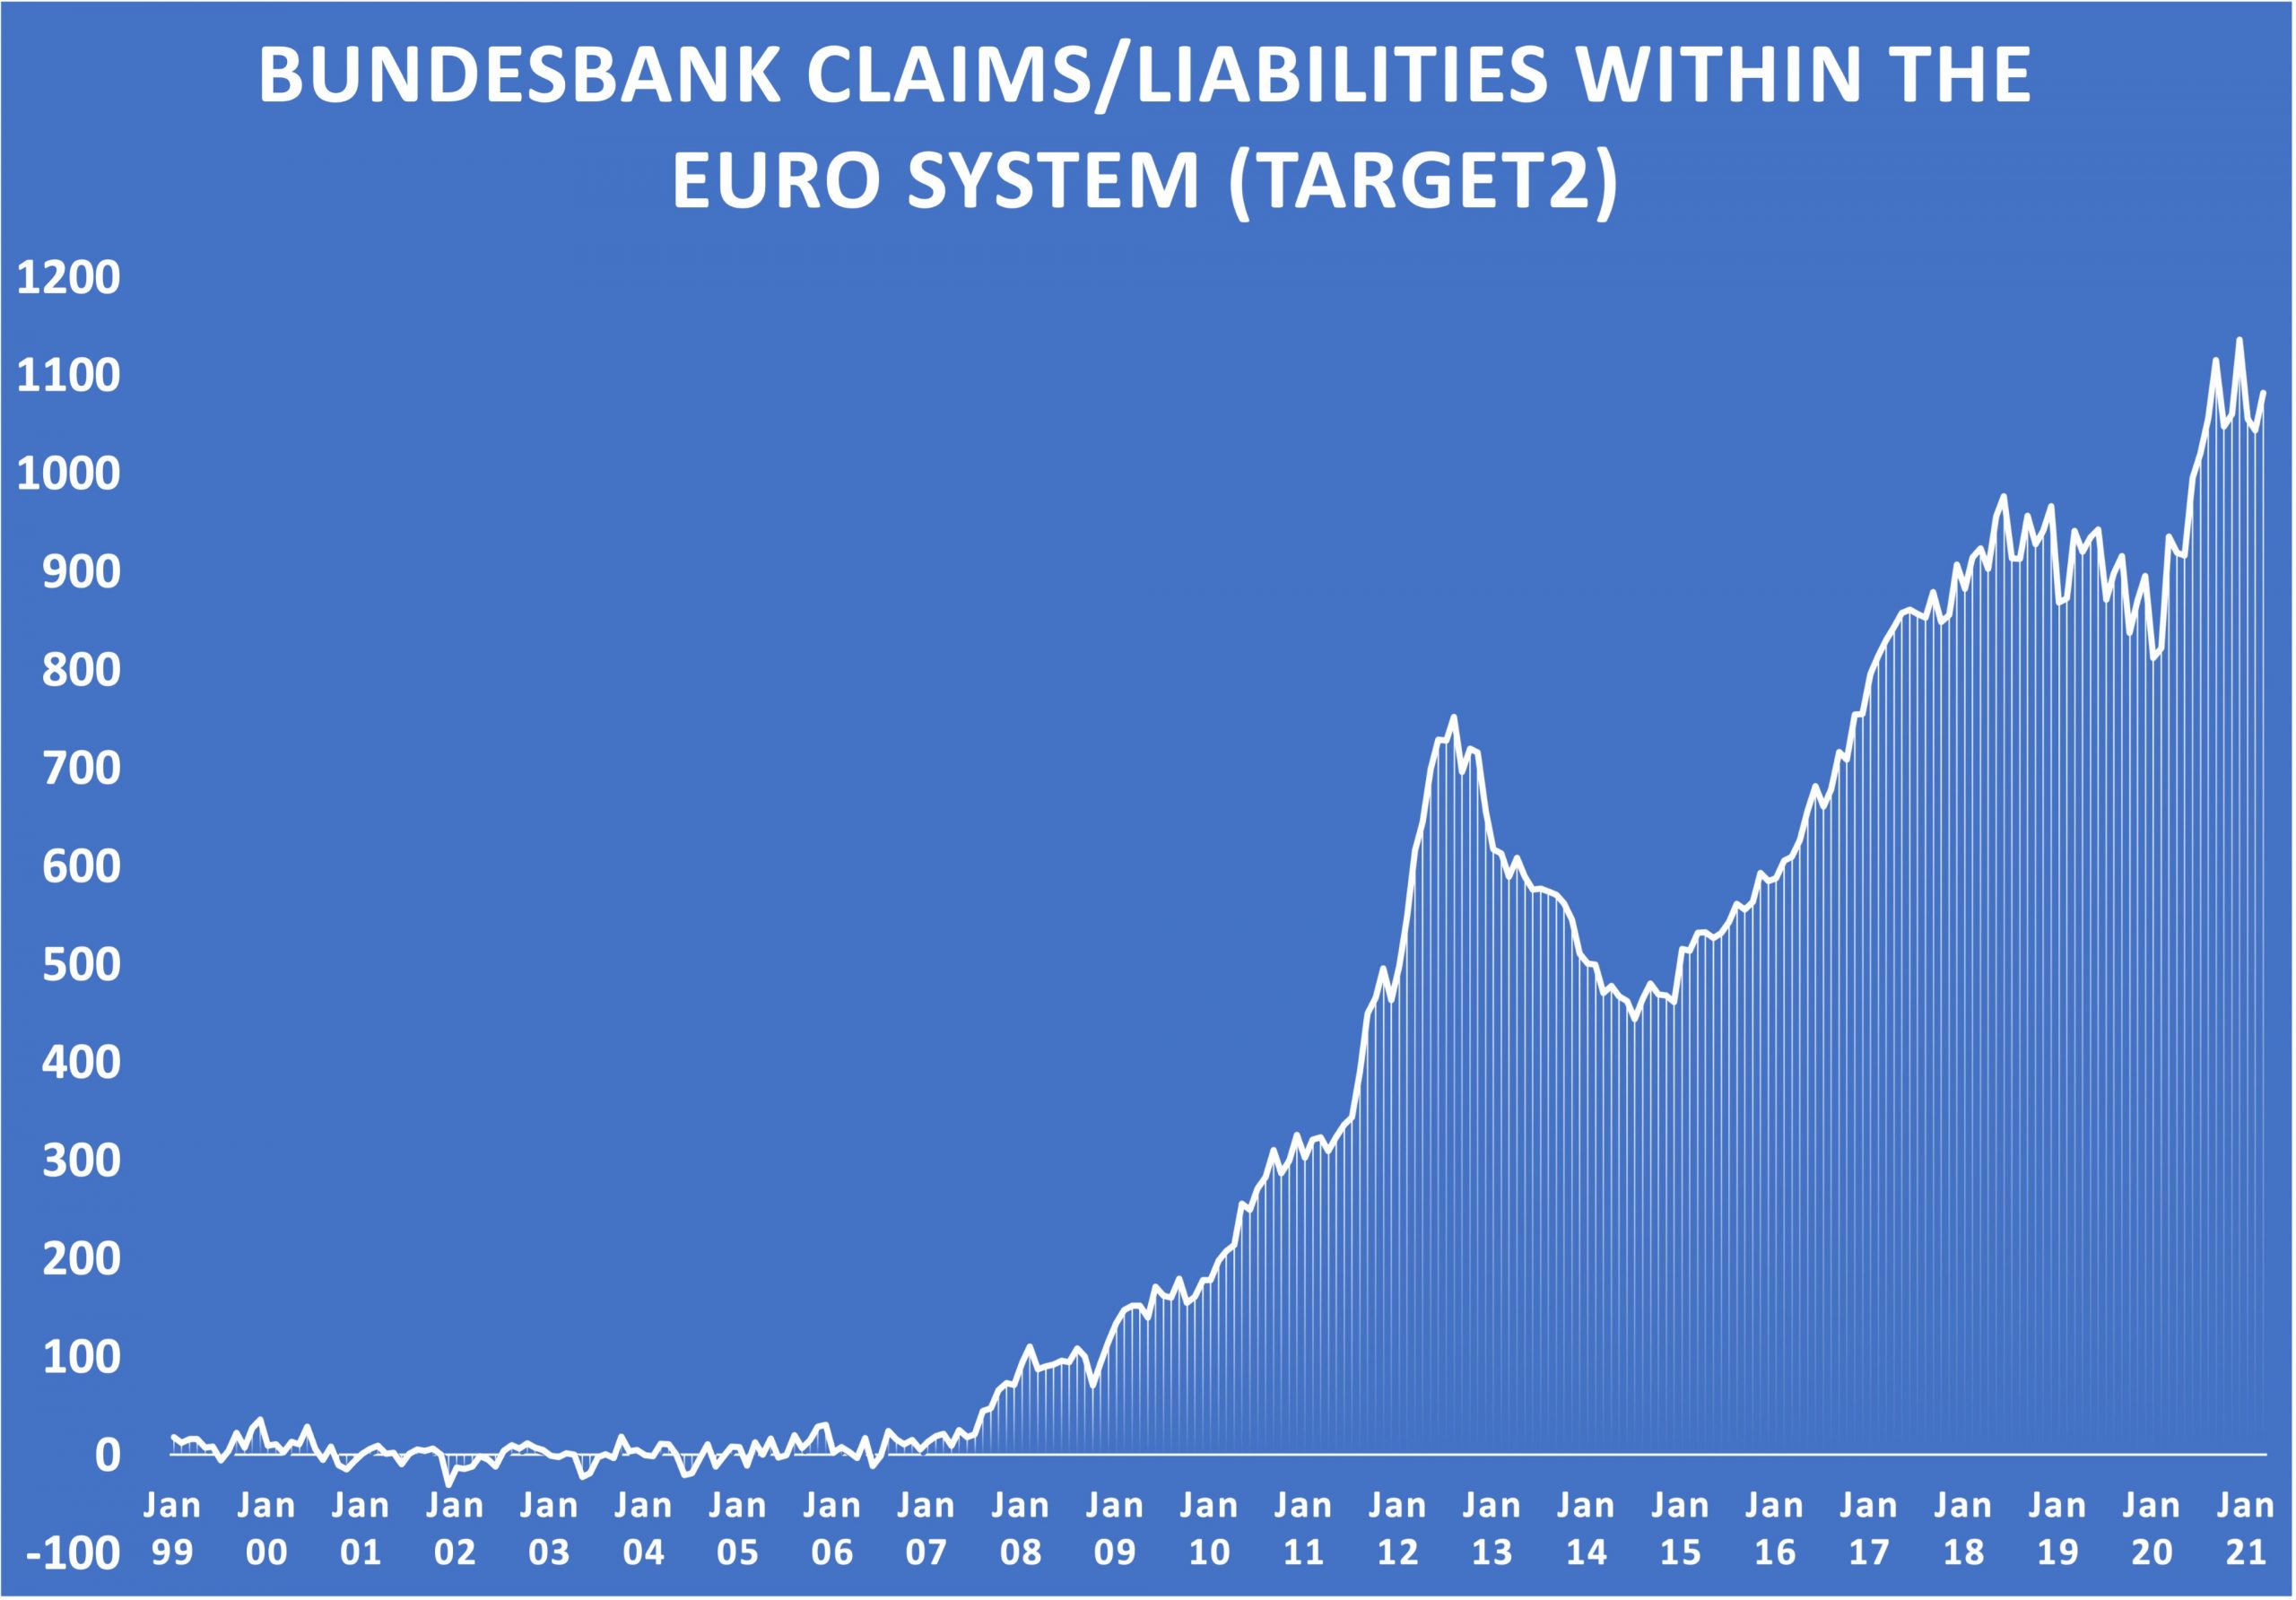
Nevertheless, Germany’s Target2 claims continue their upward trend. Meanwhile, the other EU countries owe German taxpayers 1,082 billion EUR! As long as the ECB Eurosystem remains unchanged, the Bundesbank’s Target2 balances are not risky. In the event of a breakup of the EU, on the other hand, there is a threat of dramatic proportions.
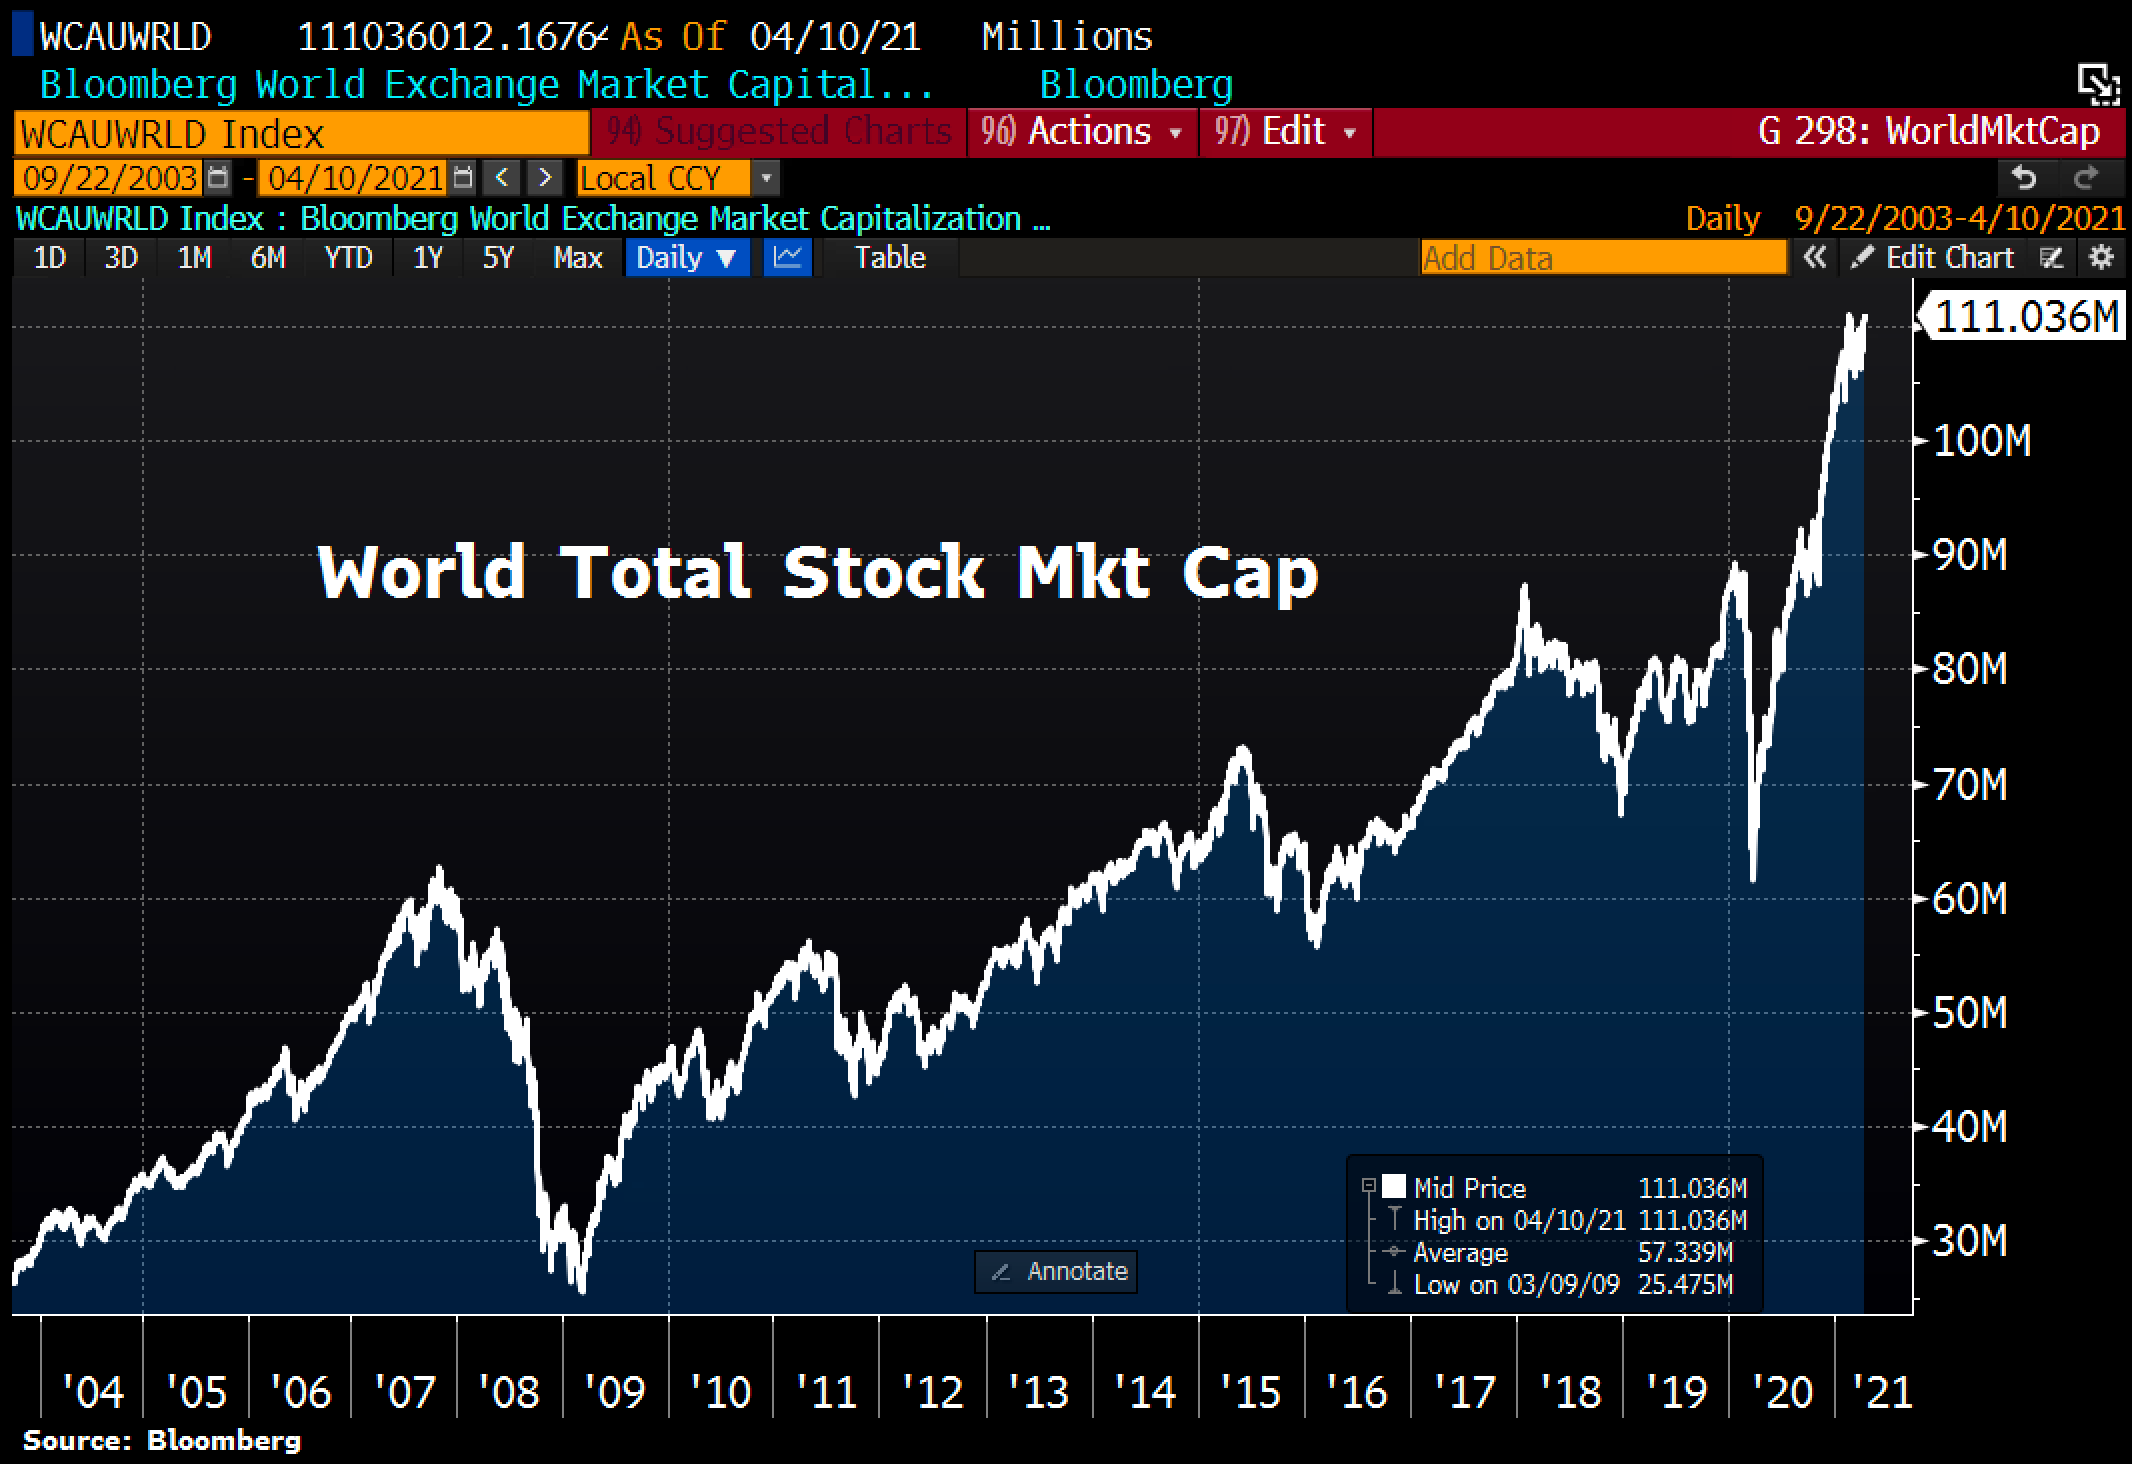
Thanks to the never-ending confetti party, the global stock markets recently rose once again to a new all-time high. Thus, the value of all equities worldwide now amounts to US$111 trillion!
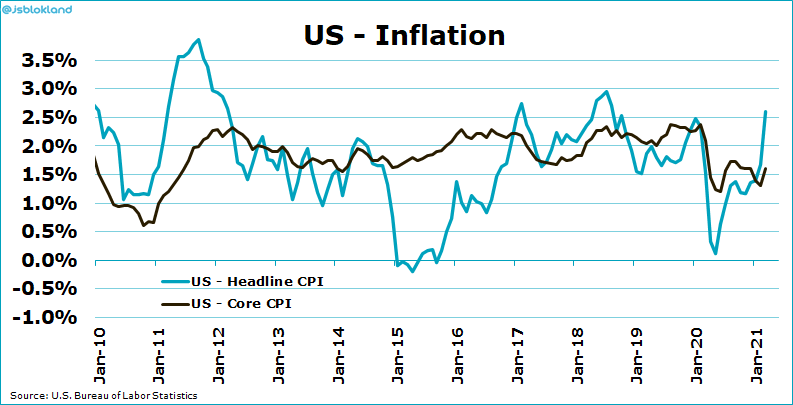
Not surprisingly, official headline inflation in the U.S. moved up to 2.6% in March. This represents the highest level since August 2018. Similarly, U.S. producer price inflation has been picking up since March 2020.
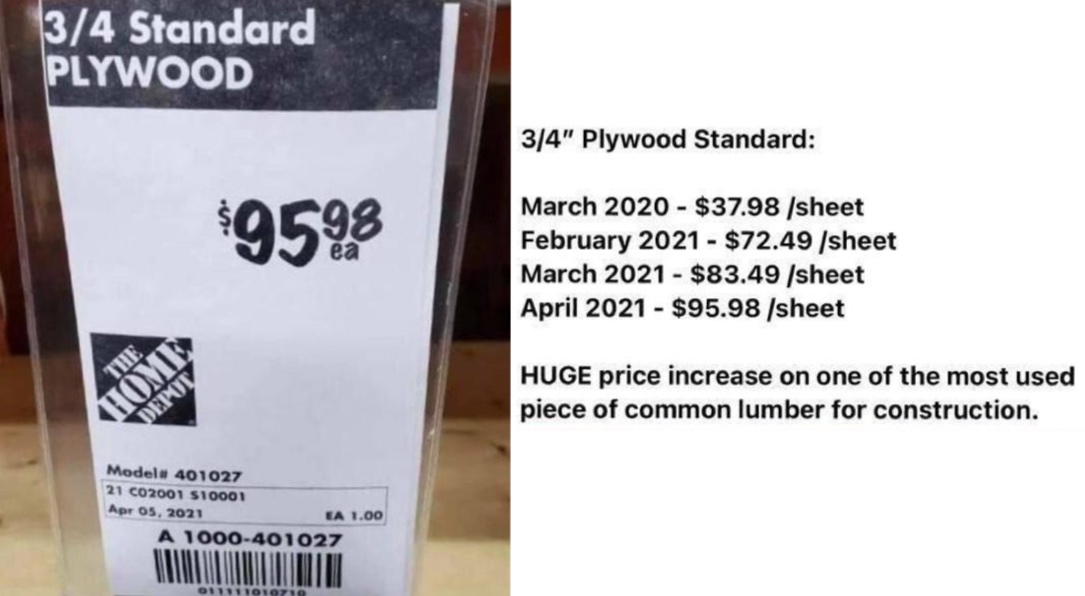
An example from the real economy shows that lumber prices in the U.S. have increased by over 150% in some cases within a year. Of course, supply bottlenecks due to the lockdown situation are also responsible for this in the background. Nevertheless, exactly this example contributes to the rising inflation expectations. Anyone currently planning to build a house must reckon with the fact that construction and material costs will continue to increase in price during the planning and construction phase.
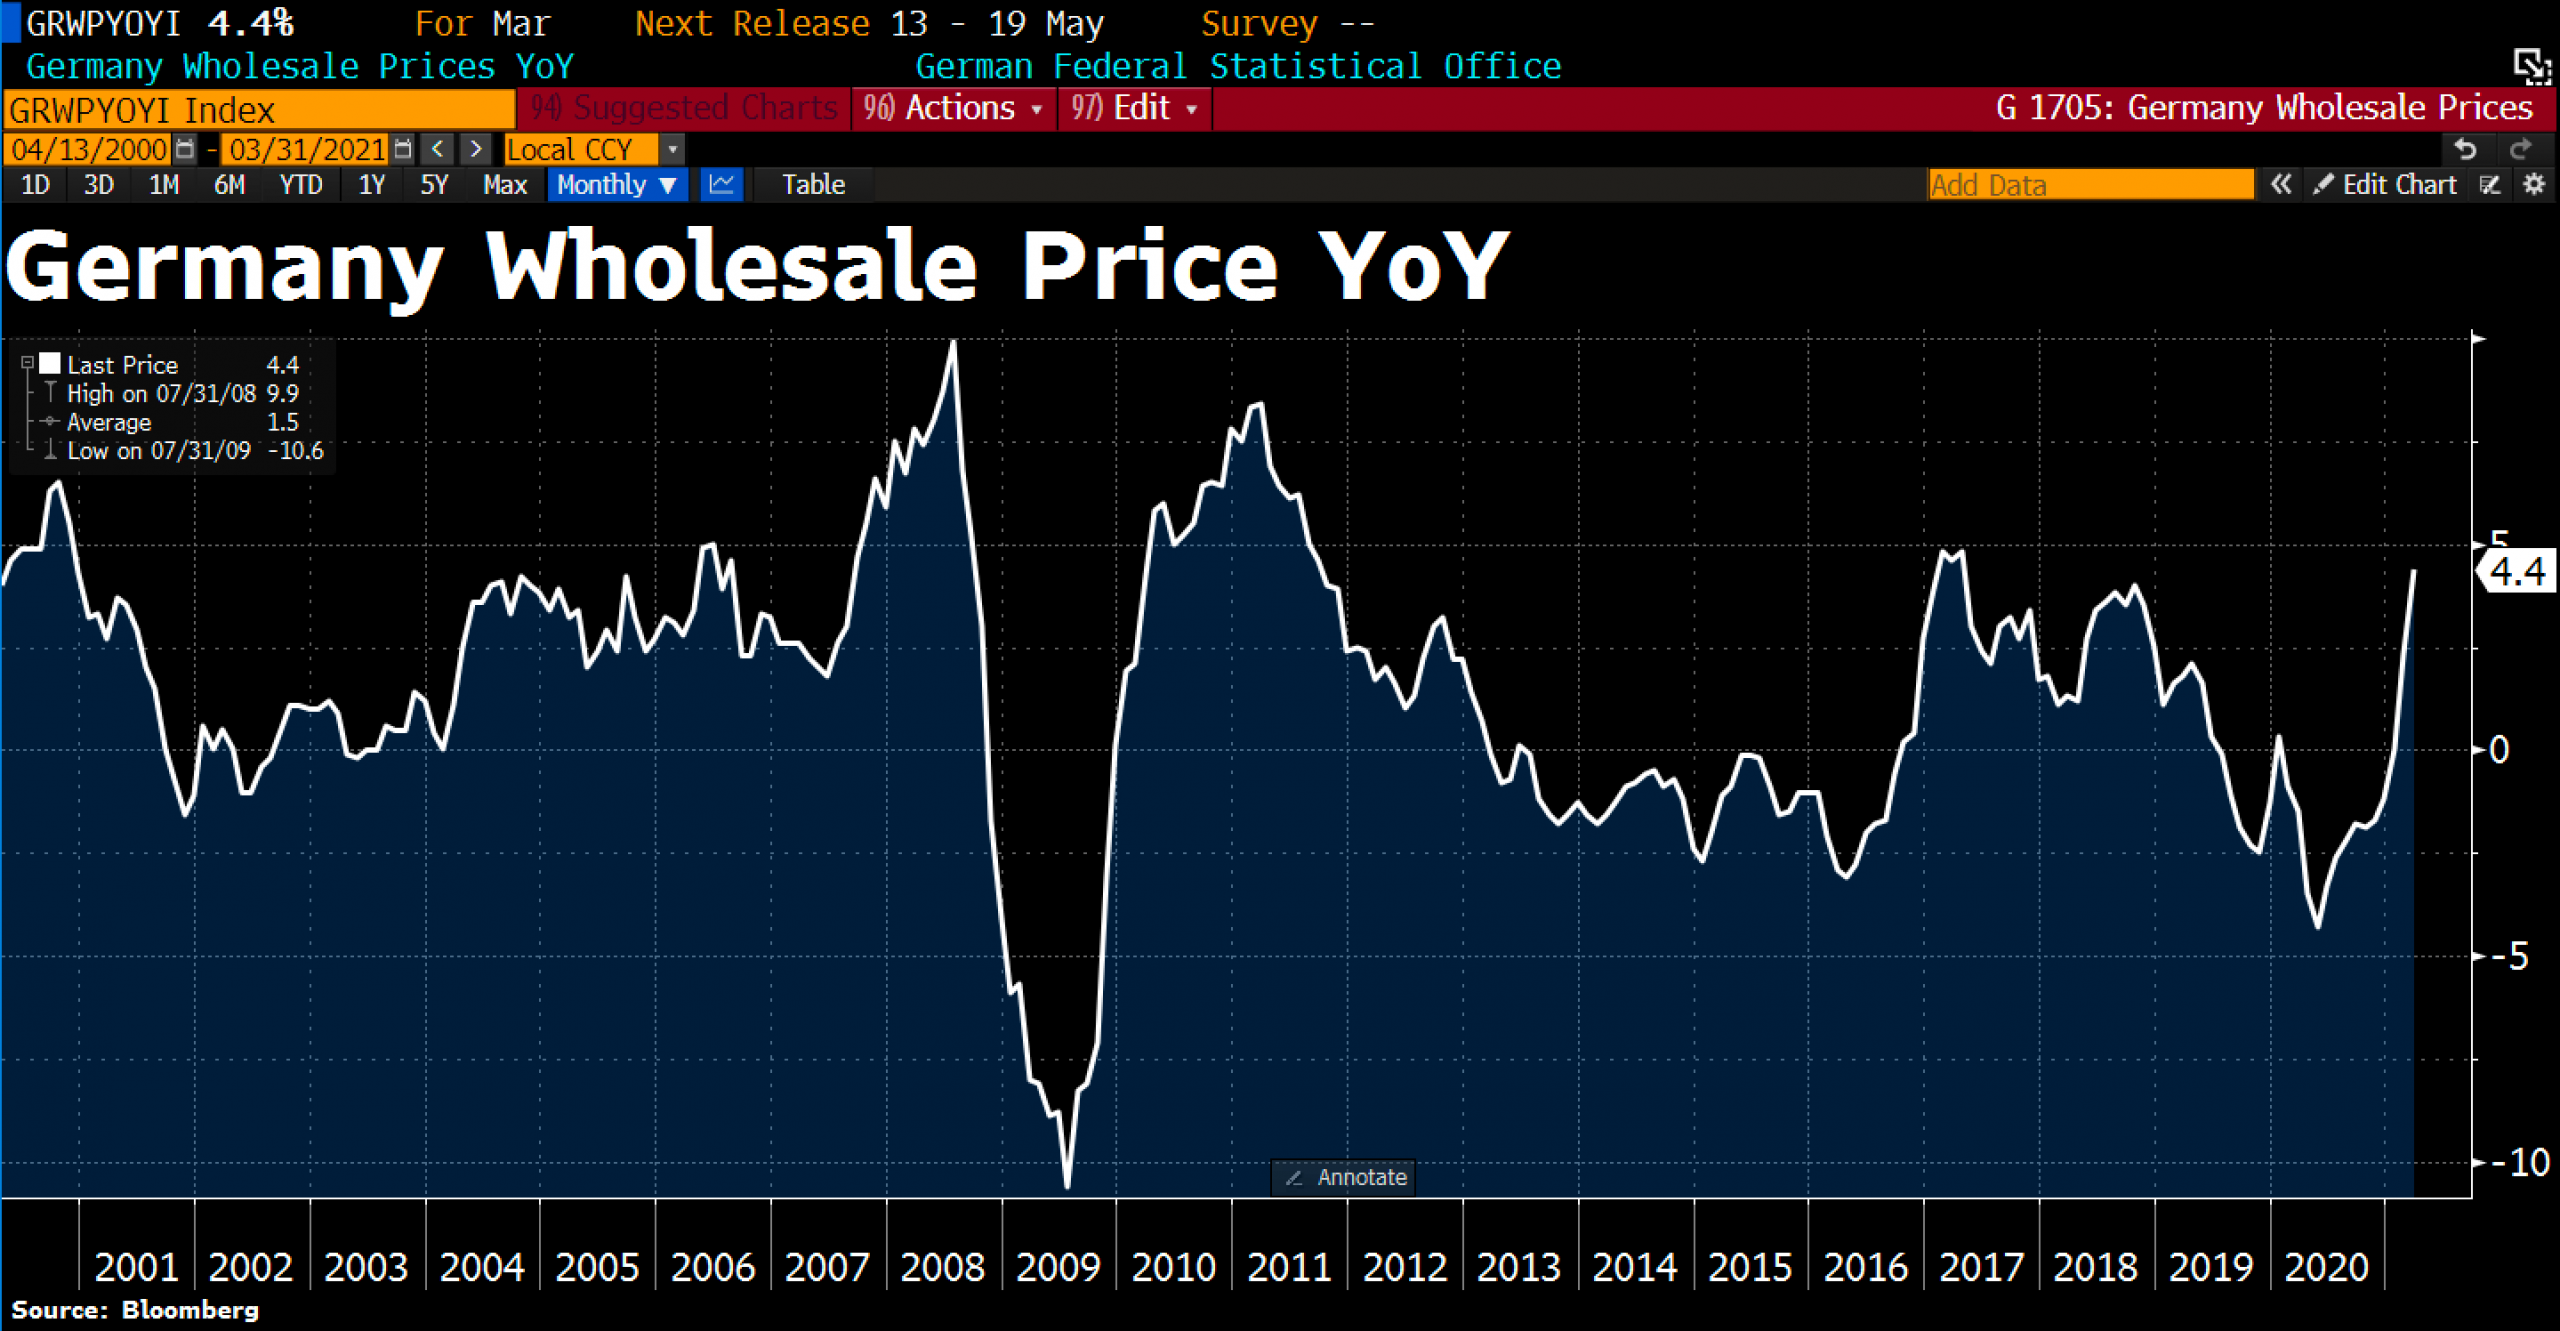
Last but not least, a look at Germany. Here, wholesale selling prices increased by 4.4% in March 2021 compared to March 2020. The last time there was a stronger year-on-year price increase was in April 2017 (+4.8%). According to the Federal Statistical Office, the increase in wholesale prices thus continued, as the year-on-year change had already been +2.3% in February 2021.
Conclusion: Gold – The turnaround has started.
In conclusion, the eight-month correction in the precious metals sector is coming to an end. Most likely, the final low at US$1,676 was already seen on March 8th. Since then, a bottom formation including a minimally higher low was observed. Of course, it may take a few more weeks or months until a new sustainable uptrend is established.
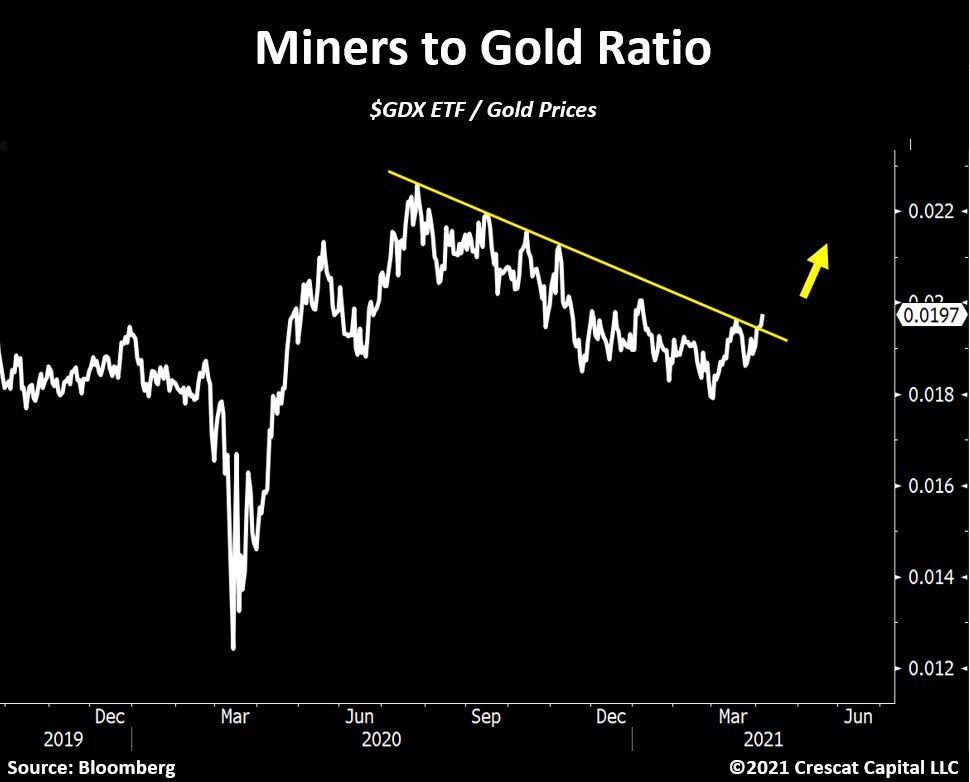
However, given the clear fundamentals (crack-up boom), precious metals prices, and therefore mining stock prices, should reach new highs in the coming years. Ideally, mining stocks (GDX) will continue their breakout against the gold price in the coming weeks. This would make the trend reversal more sustainable.
Until the summer, moderate gains towards around US$1,850 are therefore quite conceivable for the gold price. Whether it will also reach prices above the strong resistance level of US$1,950 by the end of the year is not yet foreseeable. It depends above all on the speed of the global central bank presses. At the latest, once Bitcoin will reach a temporary top in the 3rd or 4th quarter, a lot of liquidity should flow from the booming crypto sector into the precious metal sector.
To conclude, its time to be a gold bull again.
Source: www.celticgold.eu
Feel free to join us in our free Telegram channel for daily real time data and a great community.
If you like to get regular updates on our gold model, precious metals and cryptocurrencies you can subscribe to our free newsletter.


